Quantcast
Channel: AMIS Technology Blog
Viewing all 1414 articles
Browse latest View live

Using Elastic Stack, Filebeat (for log aggregation)

$
0
0

In my last article I described how I used ElasticSearch, Fluentd and Kibana (EFK). Besides log aggregation (getting log information available at a centralized location), I also described how I created some visualizations within a dashboard.
[https://technology.amis.nl/2019/05/06/using-elasticsearch-fluentd-and-kibana-for-log-aggregation/]

In a new series of articles, I will dive into using Filebeat and Logstash (from the Elastic Stack) to do the same.

In this article I will talk about the installation and use of Filebeat (without Logstash).

EFK

One popular centralized logging solution is the Elasticsearch, Fluentd, and Kibana (EFK) stack.

Fluentd
Fluentd is an open source data collector, which lets you unify the data collection and consumption for a better use and understanding of data.
[https://www.fluentd.org/]

ELK Stack

“ELK” is the acronym for three open source projects: Elasticsearch, Logstash, and Kibana.
[https://www.elastic.co/what-is/elk-stack]

In my previous article I already spoke about Elasticsearch (a search and analytics engine) <Store, Search, and Analyze> and Kibana (which lets users visualize data with charts and graphs in Elasticsearch) <Explore, Visualize, and Share>.

Elastic Stack

The Elastic Stack is the next evolution of the ELK Stack.
[https://www.elastic.co/what-is/elk-stack]

Logstash
Logstash <Collect, Enrich, and Transport> is a server-side data processing pipeline that ingests data from multiple sources simultaneously, transforms it, and then sends it to a “stash” like Elasticsearch.
[https://www.elastic.co/what-is/elk-stack]

Beats
In 2015, a family of lightweight, single-purpose data shippers were introduced into the ELK Stack equation. They are called Beats <Collect, Parse, and Ship>.
[https://www.elastic.co/what-is/elk-stack]

Filebeat
Filebeat is a lightweight shipper for forwarding and centralizing log data. Installed as an agent on your servers, Filebeat monitors the log files or locations that you specify, collects log events, and forwards them to either to Elasticsearch or Logstash for indexing.
[https://www.elastic.co/guide/en/beats/filebeat/current/filebeat-overview.html]

This time I won’t be using Fluentd for log aggregation. I leave it up to you to decide which product is most suitable for (log) data collection in your situation.

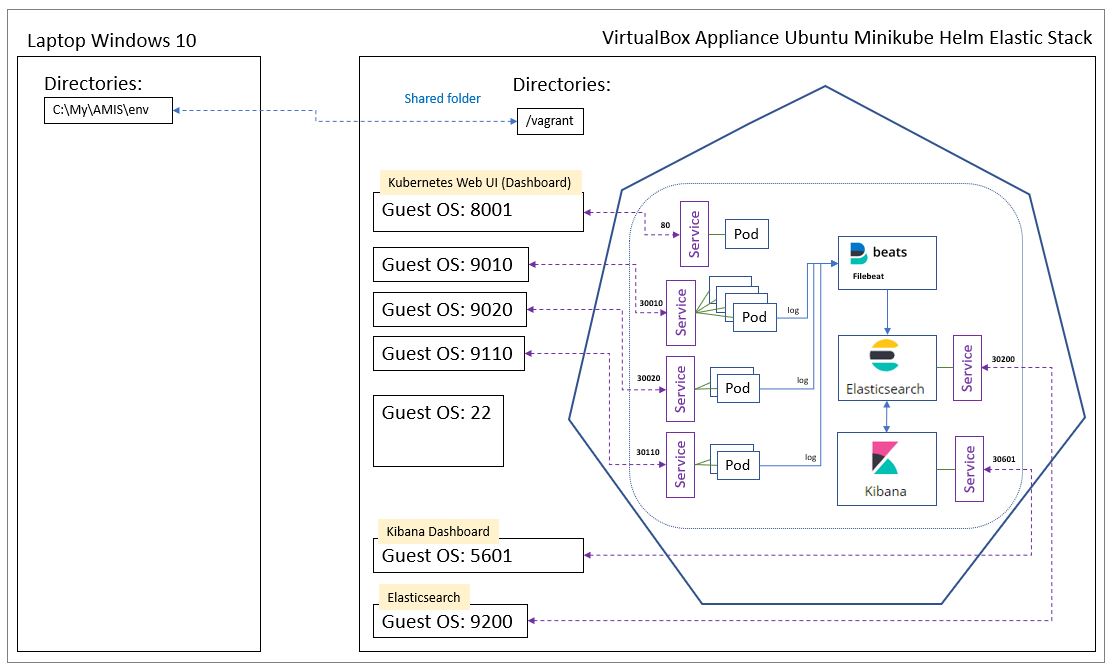
In a previous series of articles, I talked about an environment, I prepared on my Windows laptop, with a guest Operating System, Docker and Minikube available within an Oracle VirtualBox appliance , with the help of Vagrant. And now also I will be using that environment.

Log aggregation

In a containerized environment like Kubernetes, Pods and the containers within them, can be created and deleted automatically via ReplicaSet’s. So, it’s not always easy to now where in your environment, you can find the log file that you need, to analyze a problem that occurred in a particular application. Via log aggregation, the log information becomes available at a centralized location.

In the table below, you can see an overview of the booksservice Pods that are present in the demo environment, including the labels that are used:

Spring Boot application Service endpoint Pod Namespace Label key
Environment Database app version environment
DEV H2 in memory http://localhost:9010/books booksservice-v1.0-* nl-amis-development booksservice 1.0 development
http://localhost:9020/books booksservice-v2.0-* nl-amis-development booksservice 2.0 development
TST MySQL http://localhost:9110/books booksservice-v1.0-* nl-amis-testing booksservice 1.0 testing

Labels are key/value pairs that are attached to objects, such as pods. Labels are intended to be used to specify identifying attributes of objects that are meaningful and relevant to users, but do not directly imply semantics to the core system. Labels can be used to organize and to select subsets of objects. Labels can be attached to objects at creation time and subsequently added and modified at any time. Each object can have a set of key/value labels defined. Each Key must be unique for a given object.
[https://kubernetes.io/docs/concepts/overview/working-with-objects/labels/]

Elastic Stack installation order

Install the Elastic Stack products you want to use in the following order:

[https://www.elastic.co/guide/en/elastic-stack/current/installing-elastic-stack.html]

When installing Filebeat, installing Logstash (for parsing and enhancing the data) is optional.

I wanted to start simple, so I started with the installation of Filebeat (without Logstash).

Installing Filebeat

You can use Filebeat Docker images on Kubernetes to retrieve and ship the container logs.

You deploy Filebeat as a DaemonSet to ensure there’s a running instance on each node of the cluster.

The Docker logs host folder (/var/lib/docker/containers) is mounted on the Filebeat container. Filebeat starts an input for the files and begins harvesting them as soon as they appear in the folder.

I found an example Kubernetes manifest file in order to setup Filebeat, in the Elastic Filebeat documentation:

curl -L -O https://raw.githubusercontent.com/elastic/beats/7.3/deploy/kubernetes/filebeat-kubernetes.yaml

[https://www.elastic.co/guide/en/beats/filebeat/7.3/running-on-kubernetes.html]

In line with how a previously set up my environment , from this example manifest file, I created the following manifest files (with my own namespace and labels):

  • configmap-filebeat.yaml
apiVersion: v1
kind: ConfigMap
metadata:
  name: filebeat-configmap
  namespace: nl-amis-logging
  labels:
    app: filebeat
    version: "1.0"
    environment: logging
data:
  filebeat.yml: |-
    filebeat.inputs:
    - type: container
      paths:
        - /var/log/containers/*.log
      processors:
        - add_kubernetes_metadata:
            in_cluster: true
            host: ${NODE_NAME}
            matchers:
            - logs_path:
                logs_path: "/var/log/containers/"

    # To enable hints based autodiscover, remove `filebeat.inputs` configuration and uncomment this:
    #filebeat.autodiscover:
    #  providers:
    #    - type: kubernetes
    #      host: ${NODE_NAME}
    #      hints.enabled: true
    #      hints.default_config:
    #        type: container
    #        paths:
    #          - /var/log/containers/*${data.kubernetes.container.id}.log

    processors:
      - add_cloud_metadata:
      - add_host_metadata:

    cloud.id: ${ELASTIC_CLOUD_ID}
    cloud.auth: ${ELASTIC_CLOUD_AUTH}

    output.elasticsearch:
      hosts: ['${ELASTICSEARCH_HOST:elasticsearch}:${ELASTICSEARCH_PORT:9200}']
      username: ${ELASTICSEARCH_USERNAME}
      password: ${ELASTICSEARCH_PASSWORD}

Remark about using a ConfigMap:
By using a ConfigMap, you can provide configuration data to an application without storing it in the container image or hardcoding it into the pod specification.
[https://kubernetes.io/docs/tasks/configure-pod-container/configure-pod-configmap/]

The data field (with key-value pairs) contains the configuration data. In our case the ConfigMap holds information in the form of the content of a configuration file (filebeat.yml).

Later on, I will change this and create the ConfigMap from a file, as I also did when I used Fluentd (see previous article).
[https://technology.amis.nl/2019/04/23/using-vagrant-and-shell-scripts-to-further-automate-setting-up-my-demo-environment-from-scratch-including-elasticsearch-fluentd-and-kibana-efk-within-minikube/]

  • daemonset-filebeat.yaml
apiVersion: extensions/v1beta1
kind: DaemonSet
metadata:
  name: filebeat-daemonset
  namespace: nl-amis-logging
  labels:
    app: filebeat
    version: "1.0"
    environment: logging
spec:
  template:
    metadata:
      labels:
        app: filebeat
        version: "1.0"
        environment: logging
    spec:
      serviceAccountName: filebeat-serviceaccount
      terminationGracePeriodSeconds: 30
      hostNetwork: true
      dnsPolicy: ClusterFirstWithHostNet
      containers:
      - name: filebeat
        image: docker.elastic.co/beats/filebeat:7.3.1
        args: [
          "-c", "/etc/filebeat.yml",
          "-e",
        ]
        env:
        - name: ELASTICSEARCH_HOST
          value: elasticsearch
        - name: ELASTICSEARCH_PORT
          value: "9200"
        - name: ELASTICSEARCH_USERNAME
          value: elastic
        - name: ELASTICSEARCH_PASSWORD
          value: changeme
        - name: ELASTIC_CLOUD_ID
          value:
        - name: ELASTIC_CLOUD_AUTH
          value:
        - name: NODE_NAME
          valueFrom:
            fieldRef:
              fieldPath: spec.nodeName
        securityContext:
          runAsUser: 0
          # If using Red Hat OpenShift uncomment this:
          #privileged: true
        resources:
          limits:
            memory: 200Mi
          requests:
            cpu: 100m
            memory: 100Mi
        volumeMounts:
        - name: config
          mountPath: /etc/filebeat.yml
          readOnly: true
          subPath: filebeat.yml
        - name: data
          mountPath: /usr/share/filebeat/data
        - name: varlibdockercontainers
          mountPath: /var/lib/docker/containers
          readOnly: true
        - name: varlog
          mountPath: /var/log
          readOnly: true
      volumes:
      - name: config
        configMap:
          defaultMode: 0600
          name: filebeat-configmap
      - name: varlibdockercontainers
        hostPath:
          path: /var/lib/docker/containers
      - name: varlog
        hostPath:
          path: /var/log
      # data folder stores a registry of read status for all files, so we don't send everything again on a Filebeat pod restart
      - name: data
        hostPath:
          path: /var/lib/filebeat-data
          type: DirectoryOrCreate
  • clusterrolebinding-filebeat.yaml
apiVersion: rbac.authorization.k8s.io/v1beta1
kind: ClusterRoleBinding
metadata:
  name: filebeat-clusterrolebinding
  namespace: nl-amis-logging
subjects:
- kind: ServiceAccount
  name: filebeat-serviceaccount
  namespace: nl-amis-logging
roleRef:
  kind: ClusterRole
  name: filebeat-clusterrole
  apiGroup: rbac.authorization.k8s.io
  • clusterrole-filebeat.yaml
apiVersion: rbac.authorization.k8s.io/v1beta1
kind: ClusterRole
metadata:
  name: filebeat-clusterrole
  namespace: nl-amis-logging
rules:
- apiGroups: [""] # "" indicates the core API group
  resources:
  - namespaces
  - pods
  verbs:
  - get
  - watch
  - list
  • serviceaccount-filebeat.yaml
apiVersion: v1
kind: ServiceAccount
metadata:
  name: filebeat-serviceaccount
  namespace: nl-amis-logging

Vagrantfile

I changed the content of Vagrantfile to:
[in bold, I highlighted the changes]

Vagrant.configure("2") do |config|
  config.vm.box = "ubuntu/xenial64"
  
  config.vm.define "ubuntu_minikube_helm_elastic" do |ubuntu_minikube_helm_elastic|
  
    config.vm.network "forwarded_port",
      guest: 8001,
      host:  8001,
      auto_correct: true
      
    config.vm.network "forwarded_port",
      guest: 5601,
      host:  5601,
      auto_correct: true
      
    config.vm.network "forwarded_port",
      guest: 9200,
      host:  9200,
      auto_correct: true  
      
    config.vm.network "forwarded_port",
      guest: 9010,
      host:  9010,
      auto_correct: true
      
    config.vm.network "forwarded_port",
      guest: 9020,
      host:  9020,
      auto_correct: true
      
    config.vm.network "forwarded_port",
      guest: 9110,
      host:  9110,
      auto_correct: true
      
    config.vm.provider "virtualbox" do |vb|
        vb.name = "Ubuntu Minikube Helm Elastic Stack"
        vb.memory = "8192"
        vb.cpus = "1"
        
    args = []
    config.vm.provision "shell",
        path: "scripts/docker.sh",
        args: args
        
    args = []
    config.vm.provision "shell",
        path: "scripts/minikube.sh",
        args: args
        
    args = []
    config.vm.provision "shell",
        path: "scripts/kubectl.sh",
        args: args
        
    args = []
    config.vm.provision "shell",
        path: "scripts/helm.sh",
        args: args
        
    args = []
    config.vm.provision "shell",
        path: "scripts/namespaces.sh",
        args: args
        
        args = []
    config.vm.provision "shell",
        path: "scripts/elasticsearch.sh",
        args: args
        
    args = []
    config.vm.provision "shell",
        path: "scripts/kibana.sh",
        args: args
        
    args = []
    config.vm.provision "shell",
        path: "scripts/filebeat.sh",
        args: args
        
    args = []
    config.vm.provision "shell",
        path: "scripts/mysql.sh",
        args: args
        
    args = []
    config.vm.provision "shell",
        path: "scripts/booksservices.sh",
        args: args
    end
    
  end

end

In the scripts directory I created a file filebeat.sh with the following content:

#!/bin/bash
echo "**** Begin installing Filebeat"

#Create Helm chart
echo "**** Create Helm chart"
cd /vagrant
cd helmcharts
rm -rf /vagrant/helmcharts/filebeat-chart/*
helm create filebeat-chart

rm -rf /vagrant/helmcharts/filebeat-chart/templates/*
cp /vagrant/yaml/*filebeat.yaml /vagrant/helmcharts/filebeat-chart/templates

#Exiting: error loading config file: config file ("/etc/filebeat.yaml") can only be writable by the owner but the permissions are "-rwxrwxrwx" (to fix the permissions use: 'chmod go-w /etc/filebeat.yaml')

# Install Helm chart
cd /vagrant
cd helmcharts
echo "**** Install Helm chart filebeat-chart"
helm install ./filebeat-chart --name filebeat-release

# Wait 1 minute
echo "**** Waiting 1 minute ..."
sleep 60

echo "**** Check if a certain action (list) on a resource (pods) is allowed for a specific user (system:serviceaccount:nl-amis-logging:filebeat-serviceaccount) ****"
kubectl auth can-i list pods --as="system:serviceaccount:nl-amis-logging:filebeat-serviceaccount" --namespace nl-amis-logging

#List helm releases
echo "**** List helm releases"
helm list -d

#List pods
echo "**** List pods with namespace nl-amis-logging"
kubectl get pods --namespace nl-amis-logging

#echo "**** Determine the pod name of the filebeat-* pod in namespace nl-amis-logging"
#podName=$(kubectl get pods --namespace nl-amis-logging | grep filebeat- | grep -E -o "^\S*")
#echo "---$podName---"
#echo "**** Check the log file of the $podName pod in namespace nl-amis-logging"
#log=$(kubectl logs $podName --namespace nl-amis-logging | grep "Connection opened to Elasticsearch cluster")
#echo "---$log---"

echo "**** End installing Filebeat"

From the subdirectory named env on my Windows laptop, I opened a Windows Command Prompt (cmd) and typed: vagrant up

This command creates and configures guest machines according to your Vagrantfile.
[https://www.vagrantup.com/docs/cli/up.html]

With the following output (only showing the part about Filebeat):

ubuntu_minikube_helm_elastic: **** Begin installing Filebeat
ubuntu_minikube_helm_elastic: **** Create Helm chart
ubuntu_minikube_helm_elastic: Creating filebeat-chart
ubuntu_minikube_helm_elastic: **** Install Helm chart filebeat-chart
ubuntu_minikube_helm_elastic: NAME: filebeat-release
ubuntu_minikube_helm_elastic: LAST DEPLOYED: Tue Sep 3 17:49:10 2019
ubuntu_minikube_helm_elastic: NAMESPACE: default
ubuntu_minikube_helm_elastic: STATUS: DEPLOYED
ubuntu_minikube_helm_elastic: RESOURCES:
ubuntu_minikube_helm_elastic: ==> v1/ConfigMap
ubuntu_minikube_helm_elastic: NAME
ubuntu_minikube_helm_elastic:
ubuntu_minikube_helm_elastic: DATA AGE
ubuntu_minikube_helm_elastic: filebeat-configmap 1 0s
ubuntu_minikube_helm_elastic:
ubuntu_minikube_helm_elastic: ==> v1/Pod(related)
ubuntu_minikube_helm_elastic: NAME READY STATUS RESTARTS AGE
ubuntu_minikube_helm_elastic: filebeat-daemonset-9pcvc 0/1 ContainerCreating 0 0s
ubuntu_minikube_helm_elastic:
ubuntu_minikube_helm_elastic: ==> v1/ServiceAccount
ubuntu_minikube_helm_elastic: NAME SECRETS AGE
ubuntu_minikube_helm_elastic: filebeat-serviceaccount 1 0s
ubuntu_minikube_helm_elastic:
ubuntu_minikube_helm_elastic: ==> v1beta1/ClusterRole
ubuntu_minikube_helm_elastic: NAME AGE
ubuntu_minikube_helm_elastic: filebeat-clusterrole 0s
ubuntu_minikube_helm_elastic:
ubuntu_minikube_helm_elastic: ==> v1beta1/ClusterRoleBinding
ubuntu_minikube_helm_elastic: NAME AGE
ubuntu_minikube_helm_elastic: filebeat-clusterrolebinding 0s
ubuntu_minikube_helm_elastic:
ubuntu_minikube_helm_elastic: ==> v1beta1/DaemonSet
ubuntu_minikube_helm_elastic: NAME DESIRED CURRENT READY UP-TO-DATE AVAILABLE
ubuntu_minikube_helm_elastic:
ubuntu_minikube_helm_elastic: NODE SELECTOR AGE
ubuntu_minikube_helm_elastic: filebeat-daemonset
ubuntu_minikube_helm_elastic: 1 1 0 1 0 0s
ubuntu_minikube_helm_elastic: **** Waiting 1 minute …
ubuntu_minikube_helm_elastic: **** Check if a certain action (list) on a resource (pods) is allowed for a specific user (system:serviceaccount:nl-amis-logging:filebeat-serviceaccount) ****
ubuntu_minikube_helm_elastic: yes
ubuntu_minikube_helm_elastic: **** List helm releases
ubuntu_minikube_helm_elastic: NAME REVISION UPDATED STATUS CHART APP VERSION NAMESPACE
ubuntu_minikube_helm_elastic: namespace-release 1 Tue Sep 3 17:43:28 2019 DEPLOYED namespace-chart-0.1.0 1.0 default
ubuntu_minikube_helm_elastic: elasticsearch-release 1 Tue Sep 3 17:44:01 2019 DEPLOYED elasticsearch-chart-0.1.0 1.0 default
ubuntu_minikube_helm_elastic: kibana-release 1 Tue Sep 3 17:46:36 2019 DEPLOYED kibana-chart-0.1.0 1.0 default
ubuntu_minikube_helm_elastic: filebeat-release 1 Tue Sep 3 17:49:10 2019 DEPLOYED filebeat-chart-0.1.0 1.0 default
ubuntu_minikube_helm_elastic: **** List pods with namespace nl-amis-logging
ubuntu_minikube_helm_elastic: NAME
ubuntu_minikube_helm_elastic:
ubuntu_minikube_helm_elastic: READY
ubuntu_minikube_helm_elastic:
ubuntu_minikube_helm_elastic: STATUS
ubuntu_minikube_helm_elastic:
ubuntu_minikube_helm_elastic: RESTARTS
ubuntu_minikube_helm_elastic:
ubuntu_minikube_helm_elastic: AGE
ubuntu_minikube_helm_elastic: elasticsearch-6b46c44f7c-8cs6h
ubuntu_minikube_helm_elastic:
ubuntu_minikube_helm_elastic: 1/1
ubuntu_minikube_helm_elastic:
ubuntu_minikube_helm_elastic: Running
ubuntu_minikube_helm_elastic:
ubuntu_minikube_helm_elastic: 0 6m12s
ubuntu_minikube_helm_elastic: filebeat-daemonset-9pcvc 0/1 ContainerCreating 0 62s
ubuntu_minikube_helm_elastic:
ubuntu_minikube_helm_elastic: kibana-6f96d679c4-qfps4 1/1 Running 0 3m37s
ubuntu_minikube_helm_elastic: **** End installing Filebeat

My demo environment now looks like:

Via the Kubernetes Web UI (Dashboard) I checked that the Filebeat components were created (in the nl-amis-logging namespace):

http://127.0.0.1:8001/api/v1/namespaces/kube-system/services/http:kubernetes-dashboard:/proxy/#!/pod?namespace=nl-amis-logging

  • configmap-filebeat.yaml

Navigate to Config and Storage | Config Maps:

As mentioned earlier, the data field (with key-value pairs) contains the configuration data. In our case the ConfigMap holds information in the form of the content of a configuration file (filebeat.yml).

I tried another way to check the content of the configuration file.

I started a shell to the running container:

kubectl exec -it filebeat-daemonset-q5pb2 --namespace nl-amis-logging -- cat /etc/filebeat.yml

With the following output:

filebeat.inputs:
– type: container
  paths:
    – /var/log/containers/*.log
  processors:
    – add_kubernetes_metadata:
        in_cluster: true
        host: ${NODE_NAME}
        matchers:
        – logs_path:
            logs_path: “/var/log/containers/”

# To enable hints based autodiscover, remove `filebeat.inputs` configuration and uncomment this:
#filebeat.autodiscover:
#  providers:
#    – type: kubernetes
#      host: ${NODE_NAME}
#      hints.enabled: true
#      hints.default_config:
#        type: container
#        paths:
#          – /var/log/containers/*${data.kubernetes.container.id}.log

processors:
  – add_cloud_metadata:
  – add_host_metadata:

cloud.id: ${ELASTIC_CLOUD_ID}
cloud.auth: ${ELASTIC_CLOUD_AUTH}

output.elasticsearch:
  hosts: [‘${ELASTICSEARCH_HOST:elasticsearch}:${ELASTICSEARCH_PORT:9200}’]
  username: ${ELASTICSEARCH_USERNAME}
  password: ${ELASTICSEARCH_PASSWORD}

Remark:
The double dash symbol “–” is used to separate the arguments you want to pass to the command from the kubectl arguments.
[https://kubernetes.io/docs/tasks/debug-application-cluster/get-shell-running-container/]

  • daemonset-filebeat.yaml

Navigate to Workloads | Daemons Sets:

  • clusterrolebinding-filebeat.yaml

Not applicable.

  • clusterrole-filebeat.yaml

Navigate to Cluster | Roles:

  • serviceaccount-filebeat.yaml

Navigate to Config and Storage | Secrets:

Docker container log files

Every Docker container has a folder “/var/lib/docker/containers/<containerID>” on the host machine, which contains the log file “<containerID>-json.log”.

So, I needed to know the containerID for the Pods, related tot the booksservice, in my demo environment.

I got the information using several kubectl commands, leading to the following result:

Pod Namespace Label key Container
app version environment containerID name
booksservice-v1.0-68785bc6ff-cq769 nl-amis-development booksservice 1.0 development docker://b234de2b689187f94792d45ac59fda0f2f6f6969c679d6a6ca5d8323ab8fd1c9 booksservice-v1-0-container
booksservice-v1.0-68785bc6ff-x7mf8 nl-amis-development booksservice 1.0 development docker://bff91eb16a15d0a2058919d7ce7b5077ea9d3f0542c7930f48b29ca1099a54ae booksservice-v1-0-container
booksservice-v2.0-869c5bb47d-bwdc5 nl-amis-development booksservice 2.0 development docker://4344b9a63ac54218dac88148203b2394ac973fe5d1f201a1a870f213e417122c booksservice-v2-0-container
booksservice-v2.0-869c5bb47d-nwfgf nl-amis-development booksservice 2.0 development docker://6b0e9a44932986cc6ae2353f28d4c9aff32e249abd0ac38ee22a27614aecb30f booksservice-v2-0-container
booksservice-v1.0-5bcd5fddbd-cklsw nl-amis-testing booksservice 1.0 testing docker://171b2526ae9d147dab7fb2180764d55c03c7ad706eca605ad5c849aafef5d38d booksservice-v1-0-container
booksservice-v1.0-5bcd5fddbd-n9qkx nl-amis-testing booksservice 1.0 testing docker://f7a9b8a4021073f8c7daba0000482f9f9356495beec7c8d49b9b45f0055f9c20 booksservice-v1-0-container
  • Command to list all Pods
kubectl get pods --all-namespaces

With the following output:

NAMESPACE             NAME                                    READY   STATUS    RESTARTS   AGE
kube-system           coredns-576cbf47c7-jvbzp                1/1     Running   0          23h
kube-system           coredns-576cbf47c7-mpl8t                1/1     Running   0          23h
kube-system           etcd-minikube                           1/1     Running   0          23h
kube-system           kube-addon-manager-minikube             1/1     Running   0          23h
kube-system           kube-apiserver-minikube                 1/1     Running   0          23h
kube-system           kube-controller-manager-minikube        1/1     Running   0          23h
kube-system           kube-proxy-6nhhs                        1/1     Running   0          23h
kube-system           kube-scheduler-minikube                 1/1     Running   0          23h
kube-system           kubernetes-dashboard-5bff5f8fb8-p2m57   1/1     Running   0          23h
kube-system           storage-provisioner                     1/1     Running   0          23h
kube-system           tiller-deploy-79c4c54bc4-vprfl          1/1     Running   0          23h
nl-amis-development   
booksservice-v1.0-68785bc6ff-cq769      1/1     Running   0          23h
nl-amis-development   booksservice-v1.0-68785bc6ff-x7mf8      1/1     Running   0          23h
nl-amis-development   booksservice-v2.0-869c5bb47d-bwdc5      1/1     Running   0          23h
nl-amis-development   booksservice-v2.0-869c5bb47d-nwfgf      1/1     Running   0          23h
nl-amis-logging       elasticsearch-6b46c44f7c-v569h          1/1     Running   0          23h
nl-amis-logging       filebeat-daemonset-q5pb2                1/1     Running   0          23h
nl-amis-logging       kibana-6f96d679c4-kb5qw                 1/1     Running   0          23h
nl-amis-testing       booksservice-v1.0-5bcd5fddbd-cklsw      1/1     Running   0          23h
nl-amis-testing       booksservice-v1.0-5bcd5fddbd-n9qkx      1/1     Running   0          23h
nl-amis-testing       mysql-64846c7974-w7mz9                  1/1     Running   0          23h

  • Command to get the YAML (with object information) for a particular Pod:
kubectl get pod -n nl-amis-development booksservice-v1.0-68785bc6ff-cq769 -o yaml

With the following output:

apiVersion: v1
kind: Pod
metadata:
  creationTimestamp: “2019-09-04T19:49:37Z”
  generateName: booksservice-v1.0-68785bc6ff-
  labels:
    app: booksservice
    environment: development
    pod-template-hash: 68785bc6ff
    version: “1.0”
  name
booksservice-v1.0-68785bc6ff-cq769
  namespace: nl-amis-development
  ownerReferences:
  – apiVersion: apps/v1
    blockOwnerDeletion: true
    controller: true
    kind: ReplicaSet
    name: booksservice-v1.0-68785bc6ff
    uid: 207a1cd7-cf4d-11e9-95ef-023e591c269a
  resourceVersion: “1711”
  selfLink: /api/v1/namespaces/nl-amis-development/pods/booksservice-v1.0-68785bc6ff-cq769
  uid: 208017d3-cf4d-11e9-95ef-023e591c269a
spec:
  containers:
  – env:
    – name: spring.profiles.active
      value: development
    image: booksservice:v1.0
    imagePullPolicy: IfNotPresent
    name: booksservice-v1-0-container
    ports:
    – containerPort: 9090
      protocol: TCP
    resources: {}
    terminationMessagePath: /dev/termination-log
    terminationMessagePolicy: File
    volumeMounts:
    – mountPath: /var/run/secrets/kubernetes.io/serviceaccount
      name: default-token-4kz7x
      readOnly: true
  dnsPolicy: ClusterFirst
  nodeName: minikube
  priority: 0
  restartPolicy: Always
  schedulerName: default-scheduler
  securityContext: {}
  serviceAccount: default
  serviceAccountName: default
  terminationGracePeriodSeconds: 30
  tolerations:
  – effect: NoExecute
    key: node.kubernetes.io/not-ready
    operator: Exists
    tolerationSeconds: 300
  – effect: NoExecute
    key: node.kubernetes.io/unreachable
    operator: Exists
    tolerationSeconds: 300
  volumes:
  – name: default-token-4kz7x
    secret:
      defaultMode: 420
      secretName: default-token-4kz7x
status:
  conditions:
  – lastProbeTime: null
    lastTransitionTime: “2019-09-04T19:49:37Z”
    status: “True”
    type: Initialized
  – lastProbeTime: null
    lastTransitionTime: “2019-09-04T19:49:42Z”
    status: “True”
    type: Ready
  – lastProbeTime: null
    lastTransitionTime: “2019-09-04T19:49:42Z”
    status: “True”
    type: ContainersReady
  – lastProbeTime: null
    lastTransitionTime: “2019-09-04T19:49:37Z”
    status: “True”
    type: PodScheduled
  containerStatuses:
  – containerID: docker://
b234de2b689187f94792d45ac59fda0f2f6f6969c679d6a6ca5d8323ab8fd1c9
    image: booksservice:v1.0
    imageID: docker://sha256:296bfc231d3bbbe6954ad9a18c3fdfe2d6dcb81a84ee450d433449a63dda4928
    lastState: {}
    name: booksservice-v1-0-container
    ready: true
    restartCount: 0
    state:
      running:
        startedAt: “2019-09-04T19:49:41Z”
  hostIP: 10.0.2.15
  phase: Running
  podIP: 172.17.0.12
  qosClass: BestEffort
  startTime: “2019-09-04T19:49:37Z”

  • Command which uses JSONPath expressions to filter on specific fields in the JSON object and format the output:

[https://kubernetes.io/docs/tasks/access-application-cluster/list-all-running-container-images/#list-all-containers-in-all-namespaces]

kubectl get pods --all-namespaces -o=jsonpath='{range .items[*]}[{.metadata.name}{"\t"},{.metadata.namespace}{"\t"},{.metadata.labels.app}{"\t"},{.metadata.labels.environment}{"\t"},{.metadata.labels.version}{"\t"},{range .status.containerStatuses[*]}{.containerID}{"\t"},{.name}]{"\n"}{end}{end}' |\sort

[https://kubernetes.io/docs/reference/kubectl/jsonpath/]

With the following output:

[booksservice-v1.0-5bcd5fddbd-cklsw     ,nl-amis-testing        ,booksservice   ,testing        ,1.0    ,docker://171b2526ae9d147dab7fb2180764d55c03c7ad706eca605ad5c849aafef5d38d ,booksservice-v1-0-container]
[booksservice-v1.0-5bcd5fddbd-n9qkx     ,nl-amis-testing        ,booksservice   ,testing        ,1.0    ,docker://f7a9b8a4021073f8c7daba0000482f9f9356495beec7c8d49b9b45f0055f9c20 ,booksservice-v1-0-container]
[
booksservice-v1.0-68785bc6ff-cq769     ,nl-amis-development    ,booksservice   ,development    ,1.0    ,docker://b234de2b689187f94792d45ac59fda0f2f6f6969c679d6a6ca5d8323ab8fd1c9 ,booksservice-v1-0-container]
[booksservice-v1.0-68785bc6ff-x7mf8     ,nl-amis-development    ,booksservice   ,development    ,1.0    ,docker://bff91eb16a15d0a2058919d7ce7b5077ea9d3f0542c7930f48b29ca1099a54ae ,booksservice-v1-0-container]
[booksservice-v2.0-869c5bb47d-bwdc5     ,nl-amis-development    ,booksservice   ,development    ,2.0    ,docker://4344b9a63ac54218dac88148203b2394ac973fe5d1f201a1a870f213e417122c ,booksservice-v2-0-container]
[booksservice-v2.0-869c5bb47d-nwfgf     ,nl-amis-development    ,booksservice   ,development    ,2.0    ,docker://6b0e9a44932986cc6ae2353f28d4c9aff32e249abd0ac38ee22a27614aecb30f ,booksservice-v2-0-container]
[coredns-576cbf47c7-jvbzp       ,kube-system    ,       ,       ,       ,docker://8214e5aafc1d034d03abadaf606f9b1a1303757ea4ba5d4fdb689456711e5fad      ,coredns]
[coredns-576cbf47c7-mpl8t       ,kube-system    ,       ,       ,       ,docker://c2e03eb2b0a063120980b99e9b82067d2c72c82c2d86ad7092cd1cc6edbb54a7      ,coredns]
[elasticsearch-6b46c44f7c-v569h ,nl-amis-logging        ,elasticsearch  ,logging        ,7.0.0  ,docker://b8bdbfe91a6aff0f11ef6d62eb20fe186a7fc8eec501b81d31ad327f45009e20
,elasticsearch-container]
[etcd-minikube  ,kube-system    ,       ,       ,       ,docker://74c09a3c714c19fd6cebf1990836cc8e8427e89cea079f612679999874faaa60      ,etcd]
[filebeat-daemonset-q5pb2       ,nl-amis-logging        ,filebeat       ,logging        ,1.0    ,docker://2c65d0c5b03a113fb1d1c38b25feb9379ee25840dbc7210f572c52e8b6df610c
,filebeat]
[kibana-6f96d679c4-kb5qw        ,nl-amis-logging        ,kibana ,logging        ,7.0.0  ,docker://7aa9e0be446db37ad5d0ff76d5c7a8733559f3ce5b9766871c75a56719119c68      ,kibana-container]
[kube-addon-manager-minikube    ,kube-system    ,       ,       ,v8.6   ,docker://d7918eb9fdaa79b9a202f0526caaaa36e8fa531a7fc0a83a1ee513343f6743ea      ,kube-addon-manager]
[kube-apiserver-minikube        ,kube-system    ,       ,       ,       ,docker://d57c1cea8886da34b98df15806675d08196056460c8887655a270ca98261a543      ,kube-apiserver]
[kube-controller-manager-minikube       ,kube-system    ,       ,       ,       ,docker://3312a17ec93a141143a38779e156b96b99d1b1e9f52c27011a9cff5e510410c4      ,kube-controller-manager]
[kube-proxy-6nhhs       ,kube-system    ,       ,       ,       ,docker://36d6f50d14a2854208a849da8cff1ea2fe9217b0b19d46f0aead7aff012e24a1      ,kube-proxy]
[kubernetes-dashboard-5bff5f8fb8-p2m57  ,kube-system    ,kubernetes-dashboard   ,       ,v1.10.1        ,docker://09dbb37fd83b5ed1a1e23c43403fac8d258815c67a6b791e5c5714ba69ca3b02 ,kubernetes-dashboard]
[kube-scheduler-minikube        ,kube-system    ,       ,       ,       ,docker://956c43ecd2bb3154720055d7f1abf53b2d9287a265f5236179bb232bb1a0f55d      ,kube-scheduler]
[mysql-64846c7974-w7mz9 ,nl-amis-testing        ,mysql  ,testing        ,1.0    ,docker://3d6ce5328e7ebcbdf012791fc87d45374afe137439ff13c28fa75ff5fc408f1d      ,mysql]
[storage-provisioner    ,kube-system    ,       ,       ,       ,docker://9d01d6f19dc28d7104282ccec672b211842cff9f813ef586790d8882e0ed20c4      ,storage-provisioner]
[tiller-deploy-79c4c54bc4-vprfl ,kube-system    ,helm   ,       ,       ,docker://5c36d2f20b5be0ddffae6844837b3eaf7b1ad5356a5203ea262c547c2cf80394      ,tiller]

Investigating the content of the log file for a particular Pod

There are several ways in which you can have a look at the content of the log file for a particular Pod (let’s say for the first Pod in the table shown earlier). For example:

  • Via kubectl
kubectl --namespace=nl-amis-development logs booksservice-v1.0-68785bc6ff-cq769 --tail=20

With the following output:

2019-09-04 19:51:16.268  INFO 1 — [           main] j.LocalContainerEntityManagerFactoryBean : Initialized JPA EntityManagerFactory for persistence unit ‘default’
2019-09-04 19:51:26.857  INFO 1 — [           main] o.s.s.concurrent.ThreadPoolTaskExecutor  : Initializing ExecutorService ‘applicationTaskExecutor’
2019-09-04 19:51:27.817  WARN 1 — [           main] aWebConfiguration$JpaWebMvcConfiguration : spring.jpa.open-in-view is enabled by default. Therefore, database queries may be performed during view rendering. Explicitly configure spring.jpa.open-in-view to disable this warning
2019-09-04 19:51:32.694  INFO 1 — [           main] o.s.b.w.embedded.tomcat.TomcatWebServer  : Tomcat started on port(s): 9090 (http) with context path ”
2019-09-04 19:51:32.717  INFO 1 — [           main] n.a.d.s.b.BooksServiceApplication        : Started BooksServiceApplication in 102.052 seconds (JVM running for 111.856)
2019-09-04 19:51:32.740  INFO 1 — [           main] n.a.d.s.b.BooksServiceApplication        :
—-Begin logging BooksServiceApplication—-
2019-09-04 19:51:32.742  INFO 1 — [           main] n.a.d.s.b.BooksServiceApplication        : —-System Properties from VM Arguments—-
2019-09-04 19:51:32.743  INFO 1 — [           main] n.a.d.s.b.BooksServiceApplication        : server.port: null
2019-09-04 19:51:32.748  INFO 1 — [           main] n.a.d.s.b.BooksServiceApplication        : —-Program Arguments—-
2019-09-04 19:51:32.748  INFO 1 — [           main] n.a.d.s.b.BooksServiceApplication        : Currently active profile – development
2019-09-04 19:51:32.749  INFO 1 — [           main] n.a.d.s.b.BooksServiceApplication        : —-Environment Properties—-
2019-09-04 19:51:32.787  INFO 1 — [           main] n.a.d.s.b.BooksServiceApplication        : server.port: 9090
2019-09-04 19:51:32.790  INFO 1 — [           main] n.a.d.s.b.BooksServiceApplication        : nl.amis.environment: development
2019-09-04 19:51:32.791  INFO 1 — [           main] n.a.d.s.b.BooksServiceApplication        : spring.datasource.url: null
2019-09-04 19:51:32.819  INFO 1 — [           main] n.a.d.s.b.BooksServiceApplication        : spring.datasource.username: null
2019-09-04 19:51:32.824  INFO 1 — [           main] n.a.d.s.b.BooksServiceApplication        : spring.datasource.password: null
2019-09-04 19:51:32.824  INFO 1 — [           main] n.a.d.s.b.BooksServiceApplication        : spring.jpa.database-platform: null
2019-09-04 19:51:32.835  INFO 1 — [           main] n.a.d.s.b.BooksServiceApplication        : spring.jpa.hibernate.ddl-auto: null
2019-09-04 19:51:32.856  INFO 1 — [           main] n.a.d.s.b.BooksServiceApplication        : —-End logging BooksServiceApplication—-

  • Via the Kubernetes Web UI (Dashboard)

Navigate to Workloads | Pods:

Select Pod booksservice-v1.0-68785bc6ff-cq769 and click on Logs (hamburger menu)

Every Docker container has a folder “/var/lib/docker/containers/<containerID>” on the host machine, which contains the log file “<containerID>-json.log”.

So, in my case, the log file can be found in the directory:

/var/lib/docker/containers/b234de2b689187f94792d45ac59fda0f2f6f6969c679d6a6ca5d8323ab8fd1c9

I listed the files in the directory:

sudo ls -latr /var/lib/docker/containers/b234de2b689187f94792d45ac59fda0f2f6f6969c679d6a6ca5d8323ab8fd1c9

With the following output:

total 40
drwx——  2 root root  4096 Sep  4 19:49 checkpoints
drwx——  2 root root  4096 Sep  4 19:49 mounts
drwx—— 45 root root  4096 Sep  4 19:49 ..
-rw-r–r–  1 root root  2015 Sep  4 19:49 hostconfig.json
-rw——-  1 root root  6009 Sep  4 19:49 config.v2.json
drwx——  4 root root  4096 Sep  4 19:49 .
-rw-r—–  1 root root 10078 Sep  4 19:51 
b234de2b689187f94792d45ac59fda0f2f6f6969c679d6a6ca5d8323ab8fd1c9-json.log
I showed the last 20 lines of the content of the log file:

sudo tail -n 20 /var/lib/docker/containers/b234de2b689187f94792d45ac59fda0f2f6f6969c679d6a6ca5d8323ab8fd1c9/b234de2b689187f94792d45ac59fda0f2f6f6969c679d6a6ca5d8323ab8fd1c9-json.log

With the following output:

{“log”:”2019-09-04 19:51:16.268  INFO 1 — [           main] j.LocalContainerEntityManagerFactoryBean : Initialized JPA EntityManagerFactory for persistence unit ‘default’\n”,”stream”:”stdout”,”time”:”2019-09-04T19:51:16.268984841Z”}
{“log”:”2019-09-04 19:51:26.857  INFO 1 — [           main] o.s.s.concurrent.ThreadPoolTaskExecutor  : Initializing ExecutorService ‘applicationTaskExecutor’\n”,”stream”:”stdout”,”time”:”2019-09-04T19:51:26.857813374Z”}
{“log”:”2019-09-04 19:51:27.817  WARN 1 — [           main] aWebConfiguration$JpaWebMvcConfiguration : spring.jpa.open-in-view is enabled by default. Therefore, database queries may be performed during view rendering. Explicitly configure spring.jpa.open-in-view to disable this warning\n”,”stream”:”stdout”,”time”:”2019-09-04T19:51:27.826885651Z”}
{“log”:”2019-09-04 19:51:32.694  INFO 1 — [           main] o.s.b.w.embedded.tomcat.TomcatWebServer  : Tomcat started on port(s): 9090 (http) with context path ”\n”,”stream”:”stdout”,”time”:”2019-09-04T19:51:32.694259145Z”}
{“log”:”2019-09-04 19:51:32.717  INFO 1 — [           main] n.a.d.s.b.BooksServiceApplication        : Started BooksServiceApplication in 102.052 seconds (JVM running for 111.856)\n”,”stream”:”stdout”,”time”:”2019-09-04T19:51:32.720106873Z”}
{“log”:”2019-09-04 19:51:32.740  INFO 1 — [           main] n.a.d.s.b.BooksServiceApplication        : \n”,”stream”:”stdout”,”time”:”2019-09-04T19:51:32.745608597Z”}
{“log”:”—-Begin logging BooksServiceApplication—-\n”,”stream”:”stdout”,”time”:”2019-09-04T19:51:32.745623312Z”}
{“log”:”2019-09-04 19:51:32.742  INFO 1 — [           main] n.a.d.s.b.BooksServiceApplication        : —-System Properties from VM Arguments—-\n”,”stream”:”stdout”,”time”:”2019-09-04T19:51:32.74562659Z”}
{“log”:”2019-09-04 19:51:32.743  INFO 1 — [           main] n.a.d.s.b.BooksServiceApplication        : server.port: null\n”,”stream”:”stdout”,”time”:”2019-09-04T19:51:32.776310672Z”}
{“log”:”2019-09-04 19:51:32.748  INFO 1 — [           main] n.a.d.s.b.BooksServiceApplication        : —-Program Arguments—-\n”,”stream”:”stdout”,”time”:”2019-09-04T19:51:32.776326799Z”}
{“log”:”2019-09-04 19:51:32.748  INFO 1 — [           main] n.a.d.s.b.BooksServiceApplication        : Currently active profile – development\n”,”stream”:”stdout”,”time”:”2019-09-04T19:51:32.776330584Z”}
{“log”:”2019-09-04 19:51:32.749  INFO 1 — [           main] n.a.d.s.b.BooksServiceApplication        : —-Environment Properties—-\n”,”stream”:”stdout”,”time”:”2019-09-04T19:51:32.776339916Z”}
{“log”:”2019-09-04 19:51:32.787  INFO 1 — [           main] n.a.d.s.b.BooksServiceApplication        : server.port: 9090\n”,”stream”:”stdout”,”time”:”2019-09-04T19:51:32.81186176Z”}
{“log”:”2019-09-04 19:51:32.790  INFO 1 — [           main] n.a.d.s.b.BooksServiceApplication        : nl.amis.environment: development\n”,”stream”:”stdout”,”time”:”2019-09-04T19:51:32.8118772Z”}
{“log”:”2019-09-04 19:51:32.791  INFO 1 — [           main] n.a.d.s.b.BooksServiceApplication        : spring.datasource.url: null\n”,”stream”:”stdout”,”time”:”2019-09-04T19:51:32.821143308Z”}
{“log”:”2019-09-04 19:51:32.819  INFO 1 — [           main] n.a.d.s.b.BooksServiceApplication        : spring.datasource.username: null\n”,”stream”:”stdout”,”time”:”2019-09-04T19:51:32.826531352Z”}
{“log”:”2019-09-04 19:51:32.824  INFO 1 — [           main] n.a.d.s.b.BooksServiceApplication        : spring.datasource.password: null\n”,”stream”:”stdout”,”time”:”2019-09-04T19:51:32.826542893Z”}
{“log”:”2019-09-04 19:51:32.824  INFO 1 — [           main] n.a.d.s.b.BooksServiceApplication        : spring.jpa.database-platform: null\n”,”stream”:”stdout”,”time”:”2019-09-04T19:51:32.834579246Z”}
{“log”:”2019-09-04 19:51:32.835  INFO 1 — [           main] n.a.d.s.b.BooksServiceApplication        : spring.jpa.hibernate.ddl-auto: null\n”,”stream”:”stdout”,”time”:”2019-09-04T19:51:32.856886746Z”}
{“log”:”2019-09-04 19:51:32.856  INFO 1 — [           main] n.a.d.s.b.BooksServiceApplication        : —-End logging BooksServiceApplication—-\n”,”stream”:”stdout”,”time”:”2019-09-04T19:51:32.857056567Z”}

I listed the files in the directory:

sudo ls -latr /var/log/containers

With the following output:

total 88
drwxrwxr-x 9 root syslog 4096 Sep  4 19:34 ..
lrwxrwxrwx 1 root root     57 Sep  4 19:34 etcd-minikube_kube-system_etcd-74c09a3c714c19fd6cebf1990836cc8e8427e89cea079f612679999874faaa60.log -> /var/log/pods/400930335566057521570dcbaf3dbb0b/etcd/0.log
lrwxrwxrwx 1 root root     67 Sep  4 19:34 kube-scheduler-minikube_kube-system_kube-scheduler-956c43ecd2bb3154720055d7f1abf53b2d9287a265f5236179bb232bb1a0f55d.log -> /var/log/pods/e1b3e16379a55d4c355fa42bc75eb023/kube-scheduler/0.log
lrwxrwxrwx 1 root root     67 Sep  4 19:34 kube-apiserver-minikube_kube-system_kube-apiserver-d57c1cea8886da34b98df15806675d08196056460c8887655a270ca98261a543.log -> /var/log/pods/56a6d3191989178a49a5c197f01f4179/kube-apiserver/0.log
lrwxrwxrwx 1 root root     76 Sep  4 19:34 kube-controller-manager-minikube_kube-system_kube-controller-manager-3312a17ec93a141143a38779e156b96b99d1b1e9f52c27011a9cff5e510410c4.log -> /var/log/pods/8ed2b4b6a766901d30591a648262d9f9/kube-controller-manager/0.log
lrwxrwxrwx 1 root root     71 Sep  4 19:34 kube-addon-manager-minikube_kube-system_kube-addon-manager-d7918eb9fdaa79b9a202f0526caaaa36e8fa531a7fc0a83a1ee513343f6743ea.log -> /var/log/pods/d682efea6fd7d1c11b13f78e8c81af08/kube-addon-manager/0.log
lrwxrwxrwx 1 root root     64 Sep  4 19:35 coredns-576cbf47c7-jvbzp_kube-system_coredns-8214e5aafc1d034d03abadaf606f9b1a1303757ea4ba5d4fdb689456711e5fad.log -> /var/log/pods/1c73e88d-cf4b-11e9-95ef-023e591c269a/coredns/0.log
lrwxrwxrwx 1 root root     64 Sep  4 19:35 coredns-576cbf47c7-mpl8t_kube-system_coredns-c2e03eb2b0a063120980b99e9b82067d2c72c82c2d86ad7092cd1cc6edbb54a7.log -> /var/log/pods/1cbca0a0-cf4b-11e9-95ef-023e591c269a/coredns/0.log
lrwxrwxrwx 1 root root     67 Sep  4 19:35 kube-proxy-6nhhs_kube-system_kube-proxy-36d6f50d14a2854208a849da8cff1ea2fe9217b0b19d46f0aead7aff012e24a1.log -> /var/log/pods/1c68b964-cf4b-11e9-95ef-023e591c269a/kube-proxy/0.log
lrwxrwxrwx 1 root root     77 Sep  4 19:36 kubernetes-dashboard-5bff5f8fb8-p2m57_kube-system_kubernetes-dashboard-09dbb37fd83b5ed1a1e23c43403fac8d258815c67a6b791e5c5714ba69ca3b02.log -> /var/log/pods/1eb91a11-cf4b-11e9-95ef-023e591c269a/kubernetes-dashboard/0.log
lrwxrwxrwx 1 root root     76 Sep  4 19:36 storage-provisioner_kube-system_storage-provisioner-9d01d6f19dc28d7104282ccec672b211842cff9f813ef586790d8882e0ed20c4.log -> /var/log/pods/1f7a6b51-cf4b-11e9-95ef-023e591c269a/storage-provisioner/0.log
lrwxrwxrwx 1 root root     63 Sep  4 19:36 tiller-deploy-79c4c54bc4-vprfl_kube-system_tiller-5c36d2f20b5be0ddffae6844837b3eaf7b1ad5356a5203ea262c547c2cf80394.log -> /var/log/pods/3a175e09-cf4b-11e9-95ef-023e591c269a/tiller/0.log
lrwxrwxrwx 1 root root     80 Sep  4 19:40 elasticsearch-6b46c44f7c-v569h_nl-amis-logging_elasticsearch-container-b8bdbfe91a6aff0f11ef6d62eb20fe186a7fc8eec501b81d31ad327f45009e20.log -> /var/log/pods/a6d793d3-cf4b-11e9-95ef-023e591c269a/elasticsearch-container/0.log
lrwxrwxrwx 1 root root     73 Sep  4 19:43 kibana-6f96d679c4-kb5qw_nl-amis-logging_kibana-container-7aa9e0be446db37ad5d0ff76d5c7a8733559f3ce5b9766871c75a56719119c68.log -> /var/log/pods/0148ec4e-cf4c-11e9-95ef-023e591c269a/kibana-container/0.log
lrwxrwxrwx 1 root root     65 Sep  4 19:44 filebeat-daemonset-q5pb2_nl-amis-logging_filebeat-2c65d0c5b03a113fb1d1c38b25feb9379ee25840dbc7210f572c52e8b6df610c.log -> /var/log/pods/5baef596-cf4c-11e9-95ef-023e591c269a/filebeat/0.log
lrwxrwxrwx 1 root root     62 Sep  4 19:45 mysql-64846c7974-w7mz9_nl-amis-testing_mysql-3d6ce5328e7ebcbdf012791fc87d45374afe137439ff13c28fa75ff5fc408f1d.log -> /var/log/pods/85319a39-cf4c-11e9-95ef-023e591c269a/mysql/0.log
lrwxrwxrwx 1 root root     84 Sep  4 19:49 booksservice-v1.0-5bcd5fddbd-cklsw_nl-amis-testing_booksservice-v1-0-container-171b2526ae9d147dab7fb2180764d55c03c7ad706eca605ad5c849aafef5d38d.log -> /var/log/pods/20936e0c-cf4d-11e9-95ef-023e591c269a/booksservice-v1-0-container/0.log
lrwxrwxrwx 1 root root     84 Sep  4 19:49 booksservice-v1.0-5bcd5fddbd-n9qkx_nl-amis-testing_booksservice-v1-0-container-f7a9b8a4021073f8c7daba0000482f9f9356495beec7c8d49b9b45f0055f9c20.log -> /var/log/pods/209cc8b9-cf4d-11e9-95ef-023e591c269a/booksservice-v1-0-container/0.log
lrwxrwxrwx 1 root root     84 Sep  4 19:49 booksservice-v1.0-68785bc6ff-x7mf8_nl-amis-development_booksservice-v1-0-container-bff91eb16a15d0a2058919d7ce7b5077ea9d3f0542c7930f48b29ca1099a54ae.log -> /var/log/pods/20897a07-cf4d-11e9-95ef-023e591c269a/booksservice-v1-0-container/0.log
lrwxrwxrwx 1 root root     84 Sep  4 19:49 booksservice-v2.0-869c5bb47d-bwdc5_nl-amis-development_booksservice-v2-0-container-4344b9a63ac54218dac88148203b2394ac973fe5d1f201a1a870f213e417122c.log -> /var/log/pods/20800711-cf4d-11e9-95ef-023e591c269a/booksservice-v2-0-container/0.log
lrwxrwxrwx 1 root root     84 Sep  4 19:49 booksservice-v2.0-869c5bb47d-nwfgf_nl-amis-development_booksservice-v2-0-container-6b0e9a44932986cc6ae2353f28d4c9aff32e249abd0ac38ee22a27614aecb30f.log -> /var/log/pods/2088e3d9-cf4d-11e9-95ef-023e591c269a/booksservice-v2-0-container/0.log
lrwxrwxrwx 1 root root     84 Sep  4 19:49 booksservice-v1.0-68785bc6ff-cq769_nl-amis-development_booksservice-v1-0-container-
b234de2b689187f94792d45ac59fda0f2f6f6969c679d6a6ca5d8323ab8fd1c9.log -> /var/log/pods/208017d3-cf4d-11e9-95ef-023e591c269a/booksservice-v1-0-container/0.log
drwxr-xr-x 2 root root   4096 Sep  4 19:49 .

I showed the last 20 lines of the content of the log file:

sudo tail -n 20 /var/log/containers/booksservice-v1.0-68785bc6ff-cq769_nl-amis-development_booksservice-v1-0-container-b234de2b689187f94792d45ac59fda0f2f6f6969c679d6a6ca5d8323ab8fd1c9.log

With the following output:

{“log”:”2019-09-04 19:51:16.268  INFO 1 — [           main] j.LocalContainerEntityManagerFactoryBean : Initialized JPA EntityManagerFactory for persistence unit ‘default’\n”,”stream”:”stdout”,”time”:”2019-09-04T19:51:16.268984841Z”}
{“log”:”2019-09-04 19:51:26.857  INFO 1 — [           main] o.s.s.concurrent.ThreadPoolTaskExecutor  : Initializing ExecutorService ‘applicationTaskExecutor’\n”,”stream”:”stdout”,”time”:”2019-09-04T19:51:26.857813374Z”}
{“log”:”2019-09-04 19:51:27.817  WARN 1 — [           main] aWebConfiguration$JpaWebMvcConfiguration : spring.jpa.open-in-view is enabled by default. Therefore, database queries may be performed during view rendering. Explicitly configure spring.jpa.open-in-view to disable this warning\n”,”stream”:”stdout”,”time”:”2019-09-04T19:51:27.826885651Z”}
{“log”:”2019-09-04 19:51:32.694  INFO 1 — [           main] o.s.b.w.embedded.tomcat.TomcatWebServer  : Tomcat started on port(s): 9090 (http) with context path ”\n”,”stream”:”stdout”,”time”:”2019-09-04T19:51:32.694259145Z”}
{“log”:”2019-09-04 19:51:32.717  INFO 1 — [           main] n.a.d.s.b.BooksServiceApplication        : Started BooksServiceApplication in 102.052 seconds (JVM running for 111.856)\n”,”stream”:”stdout”,”time”:”2019-09-04T19:51:32.720106873Z”}
{“log”:”2019-09-04 19:51:32.740  INFO 1 — [           main] n.a.d.s.b.BooksServiceApplication        : \n”,”stream”:”stdout”,”time”:”2019-09-04T19:51:32.745608597Z”}
{“log”:”—-Begin logging BooksServiceApplication—-\n”,”stream”:”stdout”,”time”:”2019-09-04T19:51:32.745623312Z”}
{“log”:”2019-09-04 19:51:32.742  INFO 1 — [           main] n.a.d.s.b.BooksServiceApplication        : —-System Properties from VM Arguments—-\n”,”stream”:”stdout”,”time”:”2019-09-04T19:51:32.74562659Z”}
{“log”:”2019-09-04 19:51:32.743  INFO 1 — [           main] n.a.d.s.b.BooksServiceApplication        : server.port: null\n”,”stream”:”stdout”,”time”:”2019-09-04T19:51:32.776310672Z”}
{“log”:”2019-09-04 19:51:32.748  INFO 1 — [           main] n.a.d.s.b.BooksServiceApplication        : —-Program Arguments—-\n”,”stream”:”stdout”,”time”:”2019-09-04T19:51:32.776326799Z”}
{“log”:”2019-09-04 19:51:32.748  INFO 1 — [           main] n.a.d.s.b.BooksServiceApplication        : Currently active profile – development\n”,”stream”:”stdout”,”time”:”2019-09-04T19:51:32.776330584Z”}
{“log”:”2019-09-04 19:51:32.749  INFO 1 — [           main] n.a.d.s.b.BooksServiceApplication        : —-Environment Properties—-\n”,”stream”:”stdout”,”time”:”2019-09-04T19:51:32.776339916Z”}
{“log”:”2019-09-04 19:51:32.787  INFO 1 — [           main] n.a.d.s.b.BooksServiceApplication        : server.port: 9090\n”,”stream”:”stdout”,”time”:”2019-09-04T19:51:32.81186176Z”}
{“log”:”2019-09-04 19:51:32.790  INFO 1 — [           main] n.a.d.s.b.BooksServiceApplication        : nl.amis.environment: development\n”,”stream”:”stdout”,”time”:”2019-09-04T19:51:32.8118772Z”}
{“log”:”2019-09-04 19:51:32.791  INFO 1 — [           main] n.a.d.s.b.BooksServiceApplication        : spring.datasource.url: null\n”,”stream”:”stdout”,”time”:”2019-09-04T19:51:32.821143308Z”}
{“log”:”2019-09-04 19:51:32.819  INFO 1 — [           main] n.a.d.s.b.BooksServiceApplication        : spring.datasource.username: null\n”,”stream”:”stdout”,”time”:”2019-09-04T19:51:32.826531352Z”}
{“log”:”2019-09-04 19:51:32.824  INFO 1 — [           main] n.a.d.s.b.BooksServiceApplication        : spring.datasource.password: null\n”,”stream”:”stdout”,”time”:”2019-09-04T19:51:32.826542893Z”}
{“log”:”2019-09-04 19:51:32.824  INFO 1 — [           main] n.a.d.s.b.BooksServiceApplication        : spring.jpa.database-platform: null\n”,”stream”:”stdout”,”time”:”2019-09-04T19:51:32.834579246Z”}
{“log”:”2019-09-04 19:51:32.835  INFO 1 — [           main] n.a.d.s.b.BooksServiceApplication        : spring.jpa.hibernate.ddl-auto: null\n”,”stream”:”stdout”,”time”:”2019-09-04T19:51:32.856886746Z”}
{“log”:”2019-09-04 19:51:32.856  INFO 1 — [           main] n.a.d.s.b.BooksServiceApplication        : —-End logging BooksServiceApplication—-\n”,”stream”:”stdout”,”time”:”2019-09-04T19:51:32.857056567Z”}

I listed the files in the directory:

sudo ls -latr /var/log/pods

With the following output:

total 92
drwxrwxr-x  9 root syslog 4096 Sep  4 19:34 ..
drwxr-xr-x  3 root root   4096 Sep  4 19:34 400930335566057521570dcbaf3dbb0b
drwxr-xr-x  3 root root   4096 Sep  4 19:34 56a6d3191989178a49a5c197f01f4179
drwxr-xr-x  3 root root   4096 Sep  4 19:34 e1b3e16379a55d4c355fa42bc75eb023
drwxr-xr-x  3 root root   4096 Sep  4 19:34 8ed2b4b6a766901d30591a648262d9f9
drwxr-xr-x  3 root root   4096 Sep  4 19:34 d682efea6fd7d1c11b13f78e8c81af08
drwxr-xr-x  3 root root   4096 Sep  4 19:35 1c68b964-cf4b-11e9-95ef-023e591c269a
drwxr-xr-x  3 root root   4096 Sep  4 19:35 1c73e88d-cf4b-11e9-95ef-023e591c269a
drwxr-xr-x  3 root root   4096 Sep  4 19:35 1cbca0a0-cf4b-11e9-95ef-023e591c269a
drwxr-xr-x  3 root root   4096 Sep  4 19:36 1eb91a11-cf4b-11e9-95ef-023e591c269a
drwxr-xr-x  3 root root   4096 Sep  4 19:36 1f7a6b51-cf4b-11e9-95ef-023e591c269a
drwxr-xr-x  3 root root   4096 Sep  4 19:36 3a175e09-cf4b-11e9-95ef-023e591c269a
drwxr-xr-x  3 root root   4096 Sep  4 19:40 a6d793d3-cf4b-11e9-95ef-023e591c269a
drwxr-xr-x  3 root root   4096 Sep  4 19:43 0148ec4e-cf4c-11e9-95ef-023e591c269a
drwxr-xr-x  3 root root   4096 Sep  4 19:44 5baef596-cf4c-11e9-95ef-023e591c269a
drwxr-xr-x  3 root root   4096 Sep  4 19:45 85319a39-cf4c-11e9-95ef-023e591c269a
drwxr-xr-x 23 root root   4096 Sep  4 19:49 .
drwxr-xr-x  3 root root   4096 Sep  4 19:49 20936e0c-cf4d-11e9-95ef-023e591c269a
drwxr-xr-x  3 root root   4096 Sep  4 19:49 
208017d3-cf4d-11e9-95ef-023e591c269a
drwxr-xr-x  3 root root   4096 Sep  4 19:49 209cc8b9-cf4d-11e9-95ef-023e591c269a
drwxr-xr-x  3 root root   4096 Sep  4 19:49 20897a07-cf4d-11e9-95ef-023e591c269a
drwxr-xr-x  3 root root   4096 Sep  4 19:49 2088e3d9-cf4d-11e9-95ef-023e591c269a
drwxr-xr-x  3 root root   4096 Sep  4 19:49 20800711-cf4d-11e9-95ef-023e591c269a

I showed the last 20 lines of the content of the log file:

sudo tail -n 20 /var/log/pods/208017d3-cf4d-11e9-95ef-023e591c269a/booksservice-v1-0-container/0.log

With the following output:

{“log”:”2019-09-04 19:51:16.268  INFO 1 — [           main] j.LocalContainerEntityManagerFactoryBean : Initialized JPA EntityManagerFactory for persistence unit ‘default’\n”,”stream”:”stdout”,”time”:”2019-09-04T19:51:16.268984841Z”}
{“log”:”2019-09-04 19:51:26.857  INFO 1 — [           main] o.s.s.concurrent.ThreadPoolTaskExecutor  : Initializing ExecutorService ‘applicationTaskExecutor’\n”,”stream”:”stdout”,”time”:”2019-09-04T19:51:26.857813374Z”}
{“log”:”2019-09-04 19:51:27.817  WARN 1 — [           main] aWebConfiguration$JpaWebMvcConfiguration : spring.jpa.open-in-view is enabled by default. Therefore, database queries may be performed during view rendering. Explicitly configure spring.jpa.open-in-view to disable this warning\n”,”stream”:”stdout”,”time”:”2019-09-04T19:51:27.826885651Z”}
{“log”:”2019-09-04 19:51:32.694  INFO 1 — [           main] o.s.b.w.embedded.tomcat.TomcatWebServer  : Tomcat started on port(s): 9090 (http) with context path ”\n”,”stream”:”stdout”,”time”:”2019-09-04T19:51:32.694259145Z”}
{“log”:”2019-09-04 19:51:32.717  INFO 1 — [           main] n.a.d.s.b.BooksServiceApplication        : Started BooksServiceApplication in 102.052 seconds (JVM running for 111.856)\n”,”stream”:”stdout”,”time”:”2019-09-04T19:51:32.720106873Z”}
{“log”:”2019-09-04 19:51:32.740  INFO 1 — [           main] n.a.d.s.b.BooksServiceApplication        : \n”,”stream”:”stdout”,”time”:”2019-09-04T19:51:32.745608597Z”}
{“log”:”—-Begin logging BooksServiceApplication—-\n”,”stream”:”stdout”,”time”:”2019-09-04T19:51:32.745623312Z”}
{“log”:”2019-09-04 19:51:32.742  INFO 1 — [           main] n.a.d.s.b.BooksServiceApplication        : —-System Properties from VM Arguments—-\n”,”stream”:”stdout”,”time”:”2019-09-04T19:51:32.74562659Z”}
{“log”:”2019-09-04 19:51:32.743  INFO 1 — [           main] n.a.d.s.b.BooksServiceApplication        : server.port: null\n”,”stream”:”stdout”,”time”:”2019-09-04T19:51:32.776310672Z”}
{“log”:”2019-09-04 19:51:32.748  INFO 1 — [           main] n.a.d.s.b.BooksServiceApplication        : —-Program Arguments—-\n”,”stream”:”stdout”,”time”:”2019-09-04T19:51:32.776326799Z”}
{“log”:”2019-09-04 19:51:32.748  INFO 1 — [           main] n.a.d.s.b.BooksServiceApplication        : Currently active profile – development\n”,”stream”:”stdout”,”time”:”2019-09-04T19:51:32.776330584Z”}
{“log”:”2019-09-04 19:51:32.749  INFO 1 — [           main] n.a.d.s.b.BooksServiceApplication        : —-Environment Properties—-\n”,”stream”:”stdout”,”time”:”2019-09-04T19:51:32.776339916Z”}
{“log”:”2019-09-04 19:51:32.787  INFO 1 — [           main] n.a.d.s.b.BooksServiceApplication        : server.port: 9090\n”,”stream”:”stdout”,”time”:”2019-09-04T19:51:32.81186176Z”}
{“log”:”2019-09-04 19:51:32.790  INFO 1 — [           main] n.a.d.s.b.BooksServiceApplication        : nl.amis.environment: development\n”,”stream”:”stdout”,”time”:”2019-09-04T19:51:32.8118772Z”}
{“log”:”2019-09-04 19:51:32.791  INFO 1 — [           main] n.a.d.s.b.BooksServiceApplication        : spring.datasource.url: null\n”,”stream”:”stdout”,”time”:”2019-09-04T19:51:32.821143308Z”}
{“log”:”2019-09-04 19:51:32.819  INFO 1 — [           main] n.a.d.s.b.BooksServiceApplication        : spring.datasource.username: null\n”,”stream”:”stdout”,”time”:”2019-09-04T19:51:32.826531352Z”}
{“log”:”2019-09-04 19:51:32.824  INFO 1 — [           main] n.a.d.s.b.BooksServiceApplication        : spring.datasource.password: null\n”,”stream”:”stdout”,”time”:”2019-09-04T19:51:32.826542893Z”}
{“log”:”2019-09-04 19:51:32.824  INFO 1 — [           main] n.a.d.s.b.BooksServiceApplication        : spring.jpa.database-platform: null\n”,”stream”:”stdout”,”time”:”2019-09-04T19:51:32.834579246Z”}
{“log”:”2019-09-04 19:51:32.835  INFO 1 — [           main] n.a.d.s.b.BooksServiceApplication        : spring.jpa.hibernate.ddl-auto: null\n”,”stream”:”stdout”,”time”:”2019-09-04T19:51:32.856886746Z”}
{“log”:”2019-09-04 19:51:32.856  INFO 1 — [           main] n.a.d.s.b.BooksServiceApplication        : —-End logging BooksServiceApplication—-\n”,”stream”:”stdout”,”time”:”2019-09-04T19:51:32.857056567Z”}

Creating the ConfigMap from a file

In line with what I did when I used Fluentd (see previous article), I wanted to create the ConfigMap from a file. So, I changed the default configuration file location ( /etc/filebeat.yml) to: /etc/custom-config/filebeat.yml.
[https://technology.amis.nl/2019/04/23/using-vagrant-and-shell-scripts-to-further-automate-setting-up-my-demo-environment-from-scratch-including-elasticsearch-fluentd-and-kibana-efk-within-minikube/]

There for, in the vagrant directory I created a subdirectory structure configmaps/configmap-filebeat with a file filebeat.yml with the following content:

filebeat.inputs:
- type: container
  paths:
    - /var/log/containers/*.log
  processors:
    - add_kubernetes_metadata:
        in_cluster: true
        host: ${NODE_NAME}
        matchers:
        - logs_path:
            logs_path: "/var/log/containers/"

# To enable hints based autodiscover, remove `filebeat.inputs` configuration and uncomment this:
#filebeat.autodiscover:
#  providers:
#    - type: kubernetes
#      host: ${NODE_NAME}
#      hints.enabled: true
#      hints.default_config:
#        type: container
#        paths:
#          - /var/log/containers/*${data.kubernetes.container.id}.log

processors:
  - add_cloud_metadata:
  - add_host_metadata:

cloud.id: ${ELASTIC_CLOUD_ID}
cloud.auth: ${ELASTIC_CLOUD_AUTH}

output.elasticsearch:
  hosts: ['${ELASTICSEARCH_HOST:elasticsearch}:${ELASTICSEARCH_PORT:9200}']
  username: ${ELASTICSEARCH_USERNAME}
  password: ${ELASTICSEARCH_PASSWORD}

Remark:
For more information about the content of this config file, I kindly refer you to the FileBeat documentation, for example:

https://www.elastic.co/guide/en/beats/filebeat/master/add-kubernetes-metadata.html

I created a ConfigMap that holds the filebeat config file using:

kubectl create configmap filebeat-configmap --from-file=/vagrant/configmaps/configmap-filebeat --namespace nl-amis-logging

Next, I added labels to the ConfigMap using:

kubectl label configmap filebeat-configmap --namespace nl-amis-logging app=filebeat
kubectl label configmap filebeat-configmap --namespace nl-amis-logging version="1.0"
kubectl label configmap filebeat-configmap --namespace nl-amis-logging environment=logging

A ConfigMap can be created via a yaml file, but not if you want to use the from-file option, because kubernetes isn’t aware of the local file’s path.
[https://stackoverflow.com/questions/51268488/kubernetes-configmap-set-from-file-in-yaml-configuration]

You must create a ConfigMap before referencing it in a Pod specification (unless you mark the ConfigMap as “optional”). If you reference a ConfigMap that doesn’t exist, the Pod won’t start.
ConfigMaps reside in a specific namespace. A ConfigMap can only be referenced by pods residing in the same namespace.
[https://kubernetes.io/docs/tasks/configure-pod-container/configure-pod-configmap/]

When you create a ConfigMap using –from-file, the filename becomes a key stored in the data section of the ConfigMap. The file contents become the key’s value.
[https://kubernetes.io/docs/tasks/configure-pod-container/configure-pod-configmap/#add-configmap-data-to-a-volume]

On my Windows laptop, in the yaml directory, I deleted the file configmap-filebeat.yaml.

In the scripts directory I changed the file filebeat.sh to have the following content:

#!/bin/bash
echo "**** Begin installing Filebeat"

#Create ConfigMap before creating DaemonSet
kubectl create configmap filebeat-configmap --from-file=/vagrant/configmaps/configmap-filebeat --namespace nl-amis-logging

#Label ConfigMap
kubectl label configmap filebeat-configmap --namespace nl-amis-logging app=filebeat
kubectl label configmap filebeat-configmap --namespace nl-amis-logging version="1.0"
kubectl label configmap filebeat-configmap --namespace nl-amis-logging environment=logging

#List configmaps
echo "**** List configmap filebeat-configmap with namespace nl-amis-logging"
#kubectl describe configmaps filebeat-configmap --namespace nl-amis-logging
kubectl get configmaps filebeat-configmap --namespace nl-amis-logging -o yaml

#Create Helm chart
echo "**** Create Helm chart"
cd /vagrant
cd helmcharts
rm -rf /vagrant/helmcharts/filebeat-chart/*
helm create filebeat-chart

rm -rf /vagrant/helmcharts/filebeat-chart/templates/*
cp /vagrant/yaml/*filebeat.yaml /vagrant/helmcharts/filebeat-chart/templates
#Exiting: error loading config file: config file ("/etc/filebeat.yaml") can only be writable by the owner but the permissions are "-rwxrwxrwx" (to fix the permissions use: 'chmod go-w /etc/filebeat.yaml')

# Install Helm chart
cd /vagrant
cd helmcharts
echo "**** Install Helm chart filebeat-chart"
helm install ./filebeat-chart --name filebeat-release

# Wait 1 minute
echo "**** Waiting 1 minute ..."
sleep 60

echo "**** Check if a certain action (list) on a resource (pods) is allowed for a specific user (system:serviceaccount:nl-amis-logging:filebeat-serviceaccount) ****"
kubectl auth can-i list pods --as="system:serviceaccount:nl-amis-logging:filebeat-serviceaccount" --namespace nl-amis-logging

#List helm releases
echo "**** List helm releases"
helm list -d

#List pods
echo "**** List pods with namespace nl-amis-logging"
kubectl get pods --namespace nl-amis-logging

#echo "**** Determine the pod name of the filebeat-* pod in namespace nl-amis-logging"
#podName=$(kubectl get pods --namespace nl-amis-logging | grep filebeat- | grep -E -o "^\S*")
#echo "---$podName---"
#echo "**** Check the log file of the $podName pod in namespace nl-amis-logging"
#log=$(kubectl logs $podName --namespace nl-amis-logging | grep "Connection opened to Elasticsearch cluster")
#echo "---$log---"

echo "**** End installing Filebeat"

In the yaml directory I changed the file daemonset-filebeat.yaml to have the following content:

apiVersion: extensions/v1beta1
kind: DaemonSet
metadata:
  name: filebeat-daemonset
  namespace: nl-amis-logging
  labels:
    app: filebeat
    version: "1.0"
    environment: logging
spec:
  template:
    metadata:
      labels:
        app: filebeat
        version: "1.0"
        environment: logging
    spec:
      serviceAccountName: filebeat-serviceaccount
      terminationGracePeriodSeconds: 30
      hostNetwork: true
      dnsPolicy: ClusterFirstWithHostNet
      containers:
      - name: filebeat
        image: docker.elastic.co/beats/filebeat:7.3.1
        args: [
          "-c", " /etc/custom-config/filebeat.yml",
          "-e",
        ]
        env:
        - name: ELASTICSEARCH_HOST
          value: "elasticsearch-service.nl-amis-logging"
        - name: ELASTICSEARCH_PORT
          value: "9200"
        - name: ELASTICSEARCH_USERNAME
          value: elastic
        - name: ELASTICSEARCH_PASSWORD
          value: changeme
        - name: ELASTIC_CLOUD_ID
          value:
        - name: ELASTIC_CLOUD_AUTH
          value:
        - name: NODE_NAME
          valueFrom:
            fieldRef:
              fieldPath: spec.nodeName
        securityContext:
          runAsUser: 0
          # If using Red Hat OpenShift uncomment this:
          #privileged: true
        resources:
          limits:
            memory: 200Mi
          requests:
            cpu: 100m
            memory: 100Mi
        volumeMounts:
        - name: filebeat-config-volume
          mountPath: /etc/custom-config
        - name: data
          mountPath: /usr/share/filebeat/data
        - name: varlibdockercontainers
          mountPath: /var/lib/docker/containers
          readOnly: true
        - name: varlog
          mountPath: /var/log
          readOnly: true
      volumes:
      - name: filebeat-config-volume
        configMap:
          name: filebeat-configmap
      - name: varlibdockercontainers
        hostPath:
          path: /var/lib/docker/containers
      - name: varlog
        hostPath:
          path: /var/log
      # data folder stores a registry of read status for all files, so we don't send everything again on a Filebeat pod restart
      - name: data
        hostPath:
          path: /var/lib/filebeat-data
          type: DirectoryOrCreate

So, because I made some changes, I deleted and re-installed the release of Filebeat (via Helm, the package manager for Kubernetes).

helm del --purge filebeat-release

release "filebeat-release" deleted

Next, I started the shell script:

cd /vagrant/scripts
./filebeat.sh

With the following output:

**** Begin installing Filebeat
configmap/filebeat-configmap created
configmap/filebeat-configmap labeled
**** List configmap filebeat-configmap with namespace nl-amis-logging
apiVersion: v1
data:
  filebeat.yml: “filebeat.inputs:\r\n- type: container\r\n  paths:\r\n    – /var/log/containers/*.log\r\n
    \ processors:\r\n    – add_kubernetes_metadata:\r\n        in_cluster: true\r\n
    \       host: ${NODE_NAME}\r\n        matchers:\r\n        – logs_path:\r\n            logs_path:
    \”/var/log/containers/\”\r\n\r\n# To enable hints based autodiscover, remove `filebeat.inputs`
    configuration and uncomment this:\r\n#filebeat.autodiscover:\r\n#  providers:\r\n#
    \   – type: kubernetes\r\n#      host: ${NODE_NAME}\r\n#      hints.enabled: true\r\n#
    \     hints.default_config:\r\n#        type: container\r\n#        paths:\r\n#
    \         – /var/log/containers/*${data.kubernetes.container.id}.log\r\n\r\nprocessors:\r\n
    \ – add_cloud_metadata:\r\n  – add_host_metadata:\r\n\r\ncloud.id: ${ELASTIC_CLOUD_ID}\r\ncloud.auth:
    ${ELASTIC_CLOUD_AUTH}\r\n\r\noutput.elasticsearch:\r\n  hosts: [‘${ELASTICSEARCH_HOST:elasticsearch}:${ELASTICSEARCH_PORT:9200}’]\r\n
    \ username: ${ELASTICSEARCH_USERNAME}\r\n  password: ${ELASTICSEARCH_PASSWORD}”
kind: ConfigMap
metadata:
  creationTimestamp: “2019-09-08T14:34:28Z”
  labels:
    app: filebeat
    environment: logging
    version: “1.0”
  name: filebeat-configmap
  namespace: nl-amis-logging
  resourceVersion: “42432”
  selfLink: /api/v1/namespaces/nl-amis-logging/configmaps/filebeat-configmap
  uid: c381e4bd-d245-11e9-95ef-023e591c269a
**** Create Helm chart
Creating filebeat-chart
**** Install Helm chart filebeat-chart
NAME:   filebeat-release
LAST DEPLOYED: Sun Sep  8 14:34:31 2019
NAMESPACE: default
STATUS: DEPLOYED

RESOURCES:
==> v1/Pod(related)
NAME                      READY  STATUS             RESTARTS  AGE
filebeat-daemonset-bzz86  0/1    ContainerCreating  0         0s

==> v1/ServiceAccount
NAME                     SECRETS  AGE
filebeat-serviceaccount  1        0s

==> v1beta1/ClusterRole
NAME                  AGE
filebeat-clusterrole  0s

==> v1beta1/ClusterRoleBinding
NAME                         AGE
filebeat-clusterrolebinding  0s

==> v1beta1/DaemonSet
NAME                DESIRED  CURRENT  READY  UP-TO-DATE  AVAILABLE  NODE SELECTOR  AGE
filebeat-daemonset  1        1        0      1           0                   0s

**** Waiting 1 minute …
**** Check if a certain action (list) on a resource (pods) is allowed for a specific user (system:serviceaccount:nl-amis-logging:filebeat-serviceaccount) ****
yes
**** List helm releases
NAME                    REVISION        UPDATED                         STATUS          CHART                           APP VERSION     NAMESPACE
namespace-release       1               Wed Sep  4 19:38:32 2019        DEPLOYED        namespace-chart-0.1.0           1.0             default
elasticsearch-release   1               Wed Sep  4 19:39:03 2019        DEPLOYED        elasticsearch-chart-0.1.0       1.0             default
kibana-release          1               Wed Sep  4 19:41:35 2019        DEPLOYED        kibana-chart-0.1.0              1.0             default
mysql-release           1               Wed Sep  4 19:45:16 2019        DEPLOYED        mysql-chart-0.1.0               1.0             default
booksservice-release    1               Wed Sep  4 19:49:37 2019        DEPLOYED        booksservice-chart-0.1.0        1.0             default
filebeat-release        1               Sun Sep  8 14:34:31 2019        DEPLOYED        filebeat-chart-0.1.0            1.0             default
**** List pods with namespace nl-amis-logging
NAME                             READY   STATUS    RESTARTS   AGE
elasticsearch-6b46c44f7c-v569h   1/1     Running   0          3d18h
filebeat-daemonset-bzz86         1/1     Running   0          62s
kibana-6f96d679c4-kb5qw          1/1     Running   0          3d18h
**** End installing Filebeat

As can be seen in daemonset-filebeat.yaml, Filebeat uses the hostPath /var/lib/filebeat-data to persist internal data.

apiVersion: extensions/v1beta1
kind: DaemonSet
metadata:
  name: filebeat-daemonset
  namespace: nl-amis-logging
  labels:
    app: filebeat
    version: "1.0"
    environment: logging
spec:
…
# data folder stores a registry of read status for all files, so we don't send everything again on a Filebeat pod restart
      - name: data
        hostPath:
          path: /var/lib/filebeat-data
          type: DirectoryOrCreate

On the host (my virtual machine), I listed the files in the directory:

vagrant@ubuntu-xenial:/vagrant/scripts$ cd /var/lib/filebeat-data
vagrant@ubuntu-xenial:/var/lib/filebeat-data$ ls -latr

With the following output:

total 16
drwxr-xr-x 47 root root 4096 Sep  4 19:44 ..
-rw——-  1 root root   48 Sep  4 19:44 meta.json
drwxr-x—  3 root root 4096 Sep  4 19:44 registry
drwxr-xr-x  3 root root 4096 Sep  4 19:44 .

I started a shell to the running container:

kubectl exec -it filebeat-daemonset-bzz86 --namespace nl-amis-logging -- ls -latr

With the following output:

total 87644
drwxrwx— 1 root filebeat     4096 Aug 19 19:32 modules.d
drwxr-x— 1 root filebeat     4096 Aug 19 19:32 module
drwxr-x— 1 root filebeat     4096 Aug 19 19:32 kibana
-rw-r—– 1 root filebeat      290 Aug 19 19:32 filebeat.yml
-rw-r—– 1 root filebeat    78871 Aug 19 19:32 filebeat.reference.yml
-rwxr-x— 1 root filebeat 89142619 Aug 19 19:32 filebeat
-rw-r—– 1 root filebeat   242580 Aug 19 19:32 fields.yml
-rw-r—– 1 root filebeat      802 Aug 19 19:32 README.md
-rw-r—– 1 root filebeat   216284 Aug 19 19:32 NOTICE.txt
-rw-r—– 1 root filebeat    13675 Aug 19 19:32 LICENSE.txt
-rw-r—– 1 root filebeat       41 Aug 19 19:32 .build_hash.txt
drwxr-xr-x 1 root root         4096 Aug 19 19:32 ..
drwxrwx— 2 root filebeat     4096 Aug 19 19:32 logs
drwxr-x— 1 root filebeat     4096 Aug 19 19:32 .
drwxr-xr-x 3 root root         4096 Sep  4 19:44 data

I changed the directory:

kubectl exec -it filebeat-daemonset-bzz86 --namespace nl-amis-logging -- cd data

I listed the files in the directory:

vagrant@ubuntu-xenial:/var/lib/filebeat-data$ ls -latr

With the following output:

total 16
drwxr-xr-x 47 root root 4096 Sep  4 19:44 ..
-rw——-  1 root root   48 Sep  4 19:44 meta.json
drwxr-x—  3 root root 4096 Sep  4 19:44 registry
drwxr-xr-x  3 root root 4096 Sep  4 19:44 .

Remark:
The double dash symbol “–” is used to separate the arguments you want to pass to the command from the kubectl arguments.
[https://kubernetes.io/docs/tasks/debug-application-cluster/get-shell-running-container/]

Elasticsearch index

In the Kibana Dashboard via Management | Kibana | Index Patterns you can create an index pattern.
Kibana uses index patterns to retrieve data from Elasticsearch indices for things like visualizations.
[http://localhost:5601/app/kibana#/management/kibana/index_pattern?_g=()]

In the field “Index pattern” I entered filebeat*. The index pattern matched 1 index. Next, I clicked on button “Next step”.

In the field “Time Filter field name” I entered @timestamp.
The Time Filter will use this field to filter your data by time.
You can choose not to have a time field, but you will not be able to narrow down your data by a time range.
[http://localhost:5601/app/kibana#/management/kibana/index_pattern?_g=()]

Next, I clicked on button “Create index pattern”.

The Kibana index pattern filebeat* was created, with 1019 fields.
This page lists every field in the filebeat* index and the field’s associated core type as recorded by Elasticsearch. To change a field type, use the Elasticsearch Mapping API.

Kibana Dashboard, Discover

In the Kibana Dashboard via Discover you can see the log files.

Let’s shortly focus on the first hit.

Via a click on icon “>”, the document is expanded.

Kibana Dashboard, Visualize, creating a visualization

In the Kibana Dashboard via Visualize you can create a visualization.

I clicked on button “Create a visualization” and selected “Pie” as the type for the visualization.

As a source I chose the Index pattern, I created earlier.

After I selected filebeat* the following became visible.

In tab “Data”, in the Split Slices part, in the field “Aggregation” I selected Terms and in “Field” I selected kubernetes.container.name and left the other default settings as they were.
Then I clicked on the icon “Apply changes”, with the following result:

In tab “Options”, I selected the checkbox “Show Labels” and left the other default settings as they were.
Then I clicked on the icon “Apply changes”, with the following result:

So, the container names from the log files from the last 15 minutes are shown.

Postman

Remember that on my Windows laptop, I also wanted to be able to use Postman (for sending requests), via port forwarding this was made possible.
So, I used Postman to add books to and retrieve books from the book catalog. I did this for version 1.0 and 2.0 of the BooksService application.

From Postman I invoked a request named “GetAllBooksRequest” (with method “POST” and URL “http://locahost:9010/books”).
This concerns version 1.0 in the DEV environment.
A response with “Status 200 OK” was shown (with 4 books being retrieved):

From Postman I invoked a request named “GetAllBooksRequest” (with method “POST” and URL http://locahost:9020/books).
This concerns version 2.0 in the DEV environment.
A response with “Status 200 OK” was shown (with 4 books being retrieved):

From Postman I invoked a request named “GetAllBooksRequest” (with method “POST” and URL “http://locahost:9110/books”).
This concerns version 1.0 in the TST environment.
A response with “Status 200 OK” was shown (with 4 books being retrieved):

Remember, each time the getAllBooks method is called, this becomes visible in the container log file.

Kibana Dashboard, Visualize, creating a visualization

In the previously created visualization, I clicked on button “Refresh”. Then the booksservice containers became visible also.

Then I saved this Visualization, via a click on button “Save”.

In the pop-up “Save visualization”, in the field “Title” I entered containers_visualization_1. Next, I clicked on button “Confirm Save”.
In the left top of the screen this title then becomes visible.

Remark:
All the Saved Objects can be seen in the Kibana Dashboard via Management | Kibana | Saved Objects.

Filtering and enhancing the exported data

Filebeat provides a couple of options for filtering and enhancing exported data.
You can configure each input to include or exclude specific lines or files. This allows you to specify different filtering criteria for each input.
[https://www.elastic.co/guide/en/beats/filebeat/current/filtering-and-enhancing-data.html]

Filtering the exported data

I wanted to focus on the log files from the mysql and booksservice containers, so I needed to change the filter.

Remember the output from listing the directory /var/log/containers:

total 88
drwxrwxr-x 9 root syslog 4096 Sep  4 19:34 ..

lrwxrwxrwx 1 root root     65 Sep  4 19:44 filebeat-daemonset-q5pb2_nl-amis-logging_filebeat-2c65d0c5b03a113fb1d1c38b25feb9379ee25840dbc7210f572c52e8b6df610c.log -> /var/log/pods/5baef596-cf4c-11e9-95ef-023e591c269a/filebeat/0.log
lrwxrwxrwx 1 root root     62 Sep  4 19:45 
mysql-64846c7974-w7mz9_nl-amis-testing_mysql-3d6ce5328e7ebcbdf012791fc87d45374afe137439ff13c28fa75ff5fc408f1d.log -> /var/log/pods/85319a39-cf4c-11e9-95ef-023e591c269a/mysql/0.log
lrwxrwxrwx 1 root root     84 Sep  4 19:49 
booksservice-v1.0-5bcd5fddbd-cklsw_nl-amis-testing_booksservice-v1-0-container-171b2526ae9d147dab7fb2180764d55c03c7ad706eca605ad5c849aafef5d38d.log -> /var/log/pods/20936e0c-cf4d-11e9-95ef-023e591c269a/booksservice-v1-0-container/0.log
lrwxrwxrwx 1 root root     84 Sep  4 19:49 
booksservice-v1.0-5bcd5fddbd-n9qkx_nl-amis-testing_booksservice-v1-0-container-f7a9b8a4021073f8c7daba0000482f9f9356495beec7c8d49b9b45f0055f9c20.log -> /var/log/pods/209cc8b9-cf4d-11e9-95ef-023e591c269a/booksservice-v1-0-container/0.log
lrwxrwxrwx 1 root root     84 Sep  4 19:49 
booksservice-v1.0-68785bc6ff-x7mf8_nl-amis-development_booksservice-v1-0-container-bff91eb16a15d0a2058919d7ce7b5077ea9d3f0542c7930f48b29ca1099a54ae.log -> /var/log/pods/20897a07-cf4d-11e9-95ef-023e591c269a/booksservice-v1-0-container/0.log
lrwxrwxrwx 1 root root     84 Sep  4 19:49 
booksservice-v2.0-869c5bb47d-bwdc5_nl-amis-development_booksservice-v2-0-container-4344b9a63ac54218dac88148203b2394ac973fe5d1f201a1a870f213e417122c.log -> /var/log/pods/20800711-cf4d-11e9-95ef-023e591c269a/booksservice-v2-0-container/0.log
lrwxrwxrwx 1 root root     84 Sep  4 19:49 
booksservice-v2.0-869c5bb47d-nwfgf_nl-amis-development_booksservice-v2-0-container-6b0e9a44932986cc6ae2353f28d4c9aff32e249abd0ac38ee22a27614aecb30f.log -> /var/log/pods/2088e3d9-cf4d-11e9-95ef-023e591c269a/booksservice-v2-0-container/0.log
lrwxrwxrwx 1 root root     84 Sep  4 19:49 
booksservice-v1.0-68785bc6ff-cq769_nl-amis-development_booksservice-v1-0-container-b234de2b689187f94792d45ac59fda0f2f6f6969c679d6a6ca5d8323ab8fd1c9.log -> /var/log/pods/208017d3-cf4d-11e9-95ef-023e591c269a/booksservice-v1-0-container/0.log
drwxr-xr-x 2 root root   4096 Sep  4 19:49 .

Based on this output, in the subdirectory configmaps/configmap-filebeat, I changed the file filebeat.yml to the following content:

filebeat.inputs:
- type: container
  paths:
    - /var/log/containers/mysql*.log
    - /var/log/containers/booksservice*.log
  processors:
    - add_kubernetes_metadata:
        in_cluster: true
        host: ${NODE_NAME}
        matchers:
        - logs_path:
            logs_path: "/var/log/containers/"

# To enable hints based autodiscover, remove `filebeat.inputs` configuration and uncomment this:
#filebeat.autodiscover:
#  providers:
#    - type: kubernetes
#      host: ${NODE_NAME}
#      hints.enabled: true
#      hints.default_config:
#        type: container
#        paths:
#          - /var/log/containers/*${data.kubernetes.container.id}.log

processors:
  - add_cloud_metadata:
  - add_host_metadata:

cloud.id: ${ELASTIC_CLOUD_ID}
cloud.auth: ${ELASTIC_CLOUD_AUTH}

output.elasticsearch:
  hosts: ['${ELASTICSEARCH_HOST:elasticsearch}:${ELASTICSEARCH_PORT:9200}']
  username: ${ELASTICSEARCH_USERNAME}
  password: ${ELASTICSEARCH_PASSWORD}

So, because I made some changes, I deleted and re-installed the release of Filebeat (via Helm, the package manager for Kubernetes) and the ConfigMap.

helm del --purge filebeat-release

release "filebeat-release" deleted
kubectl --namespace=nl-amis-logging delete configmap filebeat-configmap

configmap "filebeat-configmap" deleted

Next, I started the shell script:

cd /vagrant/scripts
./filebeat.sh

With the following output:

**** Begin installing Filebeat
configmap/filebeat-configmap created
configmap/filebeat-configmap labeled
**** List configmap filebeat-configmap with namespace nl-amis-logging
apiVersion: v1
data:
  filebeat.yml: “filebeat.inputs:\r\n- type: container\r\n  paths:\r\n    – 
/var/log/containers/mysql*.log\r\n
    \   – 
/var/log/containers/booksservice*.log\r\n  processors:\r\n    – add_kubernetes_metadata:\r\n
    \       in_cluster: true\r\n        host: ${NODE_NAME}\r\n        matchers:\r\n
    \       – logs_path:\r\n            logs_path: \”/var/log/containers/\”\r\n\r\n#
    To enable hints based autodiscover, remove `filebeat.inputs` configuration and
    uncomment this:\r\n#filebeat.autodiscover:\r\n#  providers:\r\n#    – type: kubernetes\r\n#
    \     host: ${NODE_NAME}\r\n#      hints.enabled: true\r\n#      hints.default_config:\r\n#
    \       type: container\r\n#        paths:\r\n#          – /var/log/containers/*${data.kubernetes.container.id}.log\r\n\r\nprocessors:\r\n
    \ – add_cloud_metadata:\r\n  – add_host_metadata:\r\n\r\ncloud.id: ${ELASTIC_CLOUD_ID}\r\ncloud.auth:
    ${ELASTIC_CLOUD_AUTH}\r\n\r\noutput.elasticsearch:\r\n  hosts: [‘${ELASTICSEARCH_HOST:elasticsearch}:${ELASTICSEARCH_PORT:9200}’]\r\n
    \ username: ${ELASTICSEARCH_USERNAME}\r\n  password: ${ELASTICSEARCH_PASSWORD}”
kind: ConfigMap
metadata:
  creationTimestamp: “2019-09-12T12:28:26Z”
  labels:
    app: filebeat
    environment: logging
    version: “1.0”
  name: filebeat-configmap
  namespace: nl-amis-logging
  resourceVersion: “53891”
  selfLink: /api/v1/namespaces/nl-amis-logging/configmaps/filebeat-configmap
  uid: d1f26a17-d558-11e9-95ef-023e591c269a
**** Create Helm chart
Creating filebeat-chart
**** Install Helm chart filebeat-chart
NAME:   filebeat-release
LAST DEPLOYED: Thu Sep 12 12:28:27 2019
NAMESPACE: default
STATUS: DEPLOYED

RESOURCES:
==> v1/Pod(related)
NAME                      READY  STATUS             RESTARTS  AGE
filebeat-daemonset-hpxtl  0/1    ContainerCreating  0         0s

==> v1/ServiceAccount
NAME                     SECRETS  AGE
filebeat-serviceaccount  1        0s

==> v1beta1/ClusterRole
NAME                  AGE
filebeat-clusterrole  0s

==> v1beta1/ClusterRoleBinding
NAME                         AGE
filebeat-clusterrolebinding  0s

==> v1beta1/DaemonSet
NAME                DESIRED  CURRENT  READY  UP-TO-DATE  AVAILABLE  NODE SELECTOR  AGE
filebeat-daemonset  1        1        0      1           0                   0s

**** Waiting 1 minute …
**** Check if a certain action (list) on a resource (pods) is allowed for a specific user (system:serviceaccount:nl-amis-logging:filebeat-serviceaccount) ****
yes
**** List helm releases
NAME                    REVISION        UPDATED                         STATUS          CHART                           APP VERSION     NAMESPACE
namespace-release       1               Wed Sep  4 19:38:32 2019        DEPLOYED        namespace-chart-0.1.0           1.0             default
elasticsearch-release   1               Wed Sep  4 19:39:03 2019        DEPLOYED        elasticsearch-chart-0.1.0       1.0             default
kibana-release          1               Wed Sep  4 19:41:35 2019        DEPLOYED        kibana-chart-0.1.0              1.0             default
mysql-release           1               Wed Sep  4 19:45:16 2019        DEPLOYED        mysql-chart-0.1.0               1.0             default
booksservice-release    1               Wed Sep  4 19:49:37 2019        DEPLOYED        booksservice-chart-0.1.0        1.0             default
filebeat-release        1               Thu Sep 12 12:28:27 2019        DEPLOYED        filebeat-chart-0.1.0            1.0             default
**** List pods with namespace nl-amis-logging
NAME                             READY   STATUS    RESTARTS   AGE
elasticsearch-6b46c44f7c-v569h   1/1     Running   0          7d16h
filebeat-daemonset-hpxtl         1/1     Running   0          61s
kibana-6f96d679c4-kb5qw          1/1     Running   0          7d16h
**** End installing Filebeat

Kibana Dashboard, Discover

After a while (longer than 15 minutes), when I looked in the Kibana Dashboard via Discover there were no results found.

So, the filter seemed to work. To check this out, I used Postman to add books and retrieve books from the book catalog. I did this for version 1.0 and 2.0 of the BooksService application.

Again, I looked in the Kibana Dashboard via Discover, clicked on button “Refresh” and then there were results found.

In the previously created visualization, I clicked on button “Refresh”. Then the booksservice containers became visible.

The log files from the other containers are filtered out by Filebeat as I expected. But what happened to the log file from the mysql container?

I checked the content of that log file.

sudo tail -n 20 /var/log/containers/mysql-64846c7974-w7mz9_nl-amis-testing_mysql-3d6ce5328e7ebcbdf012791fc87d45374afe137439ff13c28fa75ff5fc408f1d.log

With the following output:

{“log”:”2019-09-04 19:45:46 1 [Note] InnoDB: Mutexes and rw_locks use GCC atomic builtins\n”,”stream”:”stderr”,”time”:”2019-09-04T19:45:46.560587534Z”}
{“log”:”2019-09-04 19:45:46 1 [Note] InnoDB: Memory barrier is not used\n”,”stream”:”stderr”,”time”:”2019-09-04T19:45:46.560618161Z”}
{“log”:”2019-09-04 19:45:46 1 [Note] InnoDB: Compressed tables use zlib 1.2.11\n”,”stream”:”stderr”,”time”:”2019-09-04T19:45:46.560648314Z”}
{“log”:”2019-09-04 19:45:46 1 [Note] InnoDB: Using Linux native AIO\n”,”stream”:”stderr”,”time”:”2019-09-04T19:45:46.56067815Z”}
{“log”:”2019-09-04 19:45:46 1 [Note] InnoDB: Using CPU crc32 instructions\n”,”stream”:”stderr”,”time”:”2019-09-04T19:45:46.560819023Z”}
{“log”:”2019-09-04 19:45:46 1 [Note] InnoDB: Initializing buffer pool, size = 128.0M\n”,”stream”:”stderr”,”time”:”2019-09-04T19:45:46.56157643Z”}
{“log”:”2019-09-04 19:45:46 1 [Note] InnoDB: Completed initialization of buffer pool\n”,”stream”:”stderr”,”time”:”2019-09-04T19:45:46.568549963Z”}
{“log”:”2019-09-04 19:45:46 1 [Note] InnoDB: Highest supported file format is Barracuda.\n”,”stream”:”stderr”,”time”:”2019-09-04T19:45:46.572777146Z”}
{“log”:”2019-09-04 19:45:46 1 [Note] InnoDB: 128 rollback segment(s) are active.\n”,”stream”:”stderr”,”time”:”2019-09-04T19:45:46.581715487Z”}
{“log”:”2019-09-04 19:45:46 1 [Note] InnoDB: Waiting for purge to start\n”,”stream”:”stderr”,”time”:”2019-09-04T19:45:46.582108737Z”}
{“log”:”2019-09-04 19:45:46 1 [Note] InnoDB: 5.6.45 started; log sequence number 1625997\n”,”stream”:”stderr”,”time”:”2019-09-04T19:45:46.632386895Z”}
{“log”:”2019-09-04 19:45:46 1 [Note] Server hostname (bind-address): ‘*’; port: 3306\n”,”stream”:”stderr”,”time”:”2019-09-04T19:45:46.632927728Z”}
{“log”:”2019-09-04 19:45:46 1 [Note] IPv6 is available.\n”,”stream”:”stderr”,”time”:”2019-09-04T19:45:46.633827748Z”}
{“log”:”2019-09-04 19:45:46 1 [Note]   – ‘::’ resolves to ‘::’;\n”,”stream”:”stderr”,”time”:”2019-09-04T19:45:46.633866785Z”}
{“log”:”2019-09-04 19:45:46 1 [Note] Server socket created on IP: ‘::’.\n”,”stream”:”stderr”,”time”:”2019-09-04T19:45:46.63390417Z”}
{“log”:”2019-09-04 19:45:46 1 [Warning] Insecure configuration for –pid-file: Location ‘/var/run/mysqld’ in the path is accessible to all OS users. Consider choosing a different directory.\n”,”stream”:”stderr”,”time”:”2019-09-04T19:45:46.634014095Z”}
{“log”:”2019-09-04 19:45:46 1 [Warning] ‘proxies_priv’ entry ‘@ root@mysql-64846c7974-w7mz9’ ignored in –skip-name-resolve mode.\n”,”stream”:”stderr”,”time”:”2019-09-04T19:45:46.634569373Z”}
{“log”:”2019-09-04 19:45:46 1 [Note] Event Scheduler: Loaded 0 events\n”,”stream”:”stderr”,”time”:”2019-09-04T19:45:46.638250709Z”}
{“log”:”
2019-09-04 19:45:46 1 [Note] mysqld: ready for connections.\n”,”stream”:”stderr”,”time”:”2019-09-04T19:45:46.638297182Z“}
{“log”:”Version: ‘5.6.45’  socket: ‘/var/run/mysqld/mysqld.sock’  port: 3306  MySQL Community Server (GPL)\n”,”stream”:”stderr”,”time”:”2019-09-04T19:45:46.638302543Z”}

So, the last time something was written to this log file, was a while ago. That’s why it didn’t turn up in the Kibana visualization for the last 15 minutes.

But, let’s check out if we can find the same information in Kibana.

In the visualization, I clicked on button “Show dates” and change the period to Sep 4, 2019 21:30 – 22:00 (taking in account the time zone) and then I clicked on button “Refresh”.

And then the mysql container became visible.

Next, I looked in the Kibana Dashboard via Discover, clicked on button “Refresh” and then there were lots of results found.

I clicked on button “Add filter” and in the field “Field” I entered kubernetes.container.name, as “Operator” I chose is and as “Value” I chose mysql. I then added another filter. In the field “Field” I entered message, as “Operator” I chose is and as “Value” I chose mysqld: ready for connections. .

I selected the first hit.

Remark:
The second hit is not visible in the listing of the content of the mysql log file, shown earlier, because there I only showed the last 20 lines!

Via a click on icon “>”, the document is expanded.

You can also choose to view the expanded document in JSON:

{
  “_index”: “filebeat-7.3.1-2019.09.08-000001”,
  “_type”: “_doc”,
  “_id”: “OOpLEW0B1Kd52Ckb7z6X”,
  “_version”: 1,
  “_score”: null,
  “_source”: {
    “@timestamp”: “2019-09-04T19:45:46.638Z”,
    “agent”: {
      “hostname”: “ubuntu-xenial”,
      “id”: “6fc91322-3f72-494f-9b52-12df04833853”,
      “version”: “7.3.1”,
      “type”: “filebeat”,
      “ephemeral_id”: “e43d286c-fa3d-4adc-9ca3-d11ddb2b052d”
    },
    “ecs”: {
      “version”: “1.0.1”
    },
    “host”: {
      “containerized”: false,
      “name”: “ubuntu-xenial”,
      “hostname”: “ubuntu-xenial”,
      “architecture”: “x86_64”,
      “os”: {
        “codename”: “Core”,
        “platform”: “centos”,
        “version”: “7 (Core)”,
        “family”: “redhat”,
        “name”: “CentOS Linux”,
        “kernel”: “4.4.0-142-generic”
      }
    },
    “stream”: “stderr”,
    “message”: “
2019-09-04 19:45:46 1 [Note] mysqld: ready for connections.“,
    “log”: {
      “offset”: 27622,
      “file”: {
        “path”: “/var/log/containers/mysql-64846c7974-w7mz9_nl-amis-testing_mysql-3d6ce5328e7ebcbdf012791fc87d45374afe137439ff13c28fa75ff5fc408f1d.log”
      }
    },
    “input”: {
      “type”: “container”
    },
    “kubernetes”: {
      “namespace”: “nl-amis-testing”,
      “replicaset”: {
        “name”: “mysql-64846c7974”
      },
      “labels”: {
        “environment”: “testing”,
        “pod-template-hash”: “64846c7974”,
        “version”: “1.0”,
        “app”: “mysql”
      },
      “pod”: {
        “uid”: “85319a39-cf4c-11e9-95ef-023e591c269a”,
        “name”: “mysql-64846c7974-w7mz9”
      },
      “node”: {
        “name”: “minikube”
      },
      “container”: {
        “name”: “mysql”
      }
    }
  },
  “fields”: {
    “@timestamp”: [
      “2019-09-04T19:45:46.638Z”
    ],
    “suricata.eve.timestamp”: [
      “2019-09-04T19:45:46.638Z”
    ]
  },
  “highlight”: {
    “kubernetes.container.name”: [
      “@kibana-highlighted-field@mysql@/kibana-highlighted-field@”
    ],
    “message”: [
      “2019-09-04 19:45:46 1 [Note] @kibana-highlighted-field@mysqld@/kibana-highlighted-field@: @kibana-highlighted-field@ready@/kibana-highlighted-field@ @kibana-highlighted-field@for@/kibana-highlighted-field@ @kibana-highlighted-field@connections@/kibana-highlighted-field@.”
    ]
  },
  “sort”: [
    1567626346638
  ]
}

In this expanded document you can see the following value for message:

2019-09-04 19:45:46 1 [Note] mysqld: ready for connections.

Enhancing the exported data

I wanted to try out some form of enhancing the exported log files. So, I decided to add some extra fields in order to add additional information to the output.

When using the log input to read lines from log files, you can, for example, use the following configuration options, which are supported by all inputs.

  • fields

Optional fields that you can specify to add additional information to the output. For example, you might add fields that you can use for filtering log data. Fields can be scalar values, arrays, dictionaries, or any nested combination of these. By default, the fields that you specify here will be grouped under a fields sub-dictionary in the output document. To store the custom fields as top-level fields, set the fields_under_root option to true. If a duplicate field is declared in the general configuration, then its value will be overwritten by the value declared here.
[https://www.elastic.co/guide/en/beats/filebeat/current/filebeat-input-log.html#filebeat-input-log-fields]
[https://www.elastic.co/guide/en/beats/filebeat/master/filebeat-input-container.html#filebeat-input-container-fields]

  • fields_under_root

If this option is set to true, the custom fields are stored as top-level fields in the output document instead of being grouped under a fields sub-dictionary. If the custom field names conflict with other field names added by Filebeat, then the custom fields overwrite the other fields.
[https://www.elastic.co/guide/en/beats/filebeat/current/filebeat-input-log.html#fields-under-root-log]
[https://www.elastic.co/guide/en/beats/filebeat/master/filebeat-input-container.html#fields-under-root-container]

You can define processors in your configuration to process events before they are sent to the configured output.
[https://www.elastic.co/guide/en/beats/filebeat/current/filtering-and-enhancing-data.html#using-processors]

The add_fields processor adds additional fields to the event. Fields can be scalar values, arrays, dictionaries, or any nested combination of these. By default, the fields that you specify will be grouped under the fields sub-dictionary in the event. To group the fields under a different sub-dictionary, use the target setting. To store the fields as top-level fields, set target: ”.

  • target
    (Optional) Sub-dictionary to put all fields into. Defaults to fields.
  • fields
    Fields to be added.

[https://www.elastic.co/guide/en/beats/filebeat/current/add-fields.html]

Based on the information above, in the subdirectory configmaps/configmap-filebeat, I changed the file filebeat.yml to the following content:

filebeat.inputs:
- type: container
  paths:
    - /var/log/containers/mysql*.log
    - /var/log/containers/booksservice*.log
  fields:
    my_custom_field1: 'value_of_my_custom_field1'
  fields_under_root: true
  processors:
    - add_kubernetes_metadata:
        in_cluster: true
        host: ${NODE_NAME}
        matchers:
        - logs_path:
            logs_path: "/var/log/containers/"
    - add_fields:
        target: my-custom-sub-dictionary1
        fields:
          my_custom_field2: 'value_of_my_custom_field2'
          my_custom_field3: 'value_of_my_custom_field3'
    - add_fields:
        target: my-custom-sub-dictionary2
        fields:
          my_custom_field4: 'value_of_my_custom_field4'
    - add_fields:
        fields:
          my_custom_field5: 'value_of_my_custom_field5'
        
# To enable hints based autodiscover, remove `filebeat.inputs` configuration and uncomment this:
#filebeat.autodiscover:
#  providers:
#    - type: kubernetes
#      host: ${NODE_NAME}
#      hints.enabled: true
#      hints.default_config:
#        type: container
#        paths:
#          - /var/log/containers/*${data.kubernetes.container.id}.log

processors:
  - add_cloud_metadata:
  - add_host_metadata:

cloud.id: ${ELASTIC_CLOUD_ID}
cloud.auth: ${ELASTIC_CLOUD_AUTH}

output.elasticsearch:
  hosts: ['${ELASTICSEARCH_HOST:elasticsearch}:${ELASTICSEARCH_PORT:9200}']
  username: ${ELASTICSEARCH_USERNAME}
  password: ${ELASTICSEARCH_PASSWORD}

So, because I made some changes, I deleted and re-installed the release of Filebeat (via Helm, the package manager for Kubernetes) and the ConfigMap.

I used Postman to retrieve books from the book catalog. I did this for version 1.0 in the TST enviroment of the BooksService application.

Again, I looked in the Kibana Dashboard via Discover, clicked on button “Refresh” and then there were results found.

I selected the first hit. Via a click on icon “>”, the document is expanded.

On the discover pane, fields with missing index-pattern-fields show hazard icons and display a warning.

To get rid of these, in the Kibana Dashboard via Management | Kibana | Index Patterns, I clicked on the icon “Refresh field list”.

Again, I looked in the Kibana Dashboard via Discover, I selected the first hit and expanded the document.

Then I chose to view the expanded document in JSON:

{
  “_index”: “filebeat-7.3.1-2019.09.08-000001”,
  “_type”: “_doc”,
  “_id”: “eer6JW0B1Kd52CkbpGMs”,
  “_version”: 1,
  “_score”: null,
  “_source”: {
    “@timestamp”: “2019-09-12T14:57:18.195Z”,
    “message”: “2019-09-12 14:57:18.188  INFO 1 — [nio-9091-exec-2] n.a.d.s.b.application.BookService        : “,
    “input”: {
      “type”: “container”
    },
    “my-custom-sub-dictionary2”: {
      “my_custom_field4”: “value_of_my_custom_field4”
    },
    “fields”: {
      “my_custom_field5”: “value_of_my_custom_field5”
    },

    “agent”: {
      “hostname”: “ubuntu-xenial”,
      “id”: “6fc91322-3f72-494f-9b52-12df04833853”,
      “version”: “7.3.1”,
      “type”: “filebeat”,
      “ephemeral_id”: “870554f1-30be-4e9f-9e1f-e288c37c6971”
    },
    “ecs”: {
      “version”: “1.0.1”
    },
    “log”: {
      “offset”: 13538,
      “file”: {
        “path”: “/var/log/containers/booksservice-v1.0-5bcd5fddbd-cklsw_nl-amis-testing_booksservice-v1-0-container-171b2526ae9d147dab7fb2180764d55c03c7ad706eca605ad5c849aafef5d38d.log”
      }
    },
    “stream”: “stdout”,
    “my_custom_field1”: “value_of_my_custom_field1”,
    “kubernetes”: {
      “container”: {
        “name”: “booksservice-v1-0-container”
      },
      “namespace”: “nl-amis-testing”,
      “replicaset”: {
        “name”: “booksservice-v1.0-5bcd5fddbd”
      },
      “labels”: {
        “version”: “1.0”,
        “app”: “booksservice”,
        “environment”: “testing”,
        “pod-template-hash”: “5bcd5fddbd”
      },
      “pod”: {
        “name”: “booksservice-v1.0-5bcd5fddbd-cklsw”,
        “uid”: “20936e0c-cf4d-11e9-95ef-023e591c269a”
      },
      “node”: {
        “name”: “minikube”
      }
    },
    “my-custom-sub-dictionary1”: {
      “my_custom_field3”: “value_of_my_custom_field3”,
      “my_custom_field2”: “value_of_my_custom_field2”
    },

    “host”: {
      “architecture”: “x86_64”,
      “os”: {
        “kernel”: “4.4.0-142-generic”,
        “codename”: “Core”,
        “platform”: “centos”,
        “version”: “7 (Core)”,
        “family”: “redhat”,
        “name”: “CentOS Linux”
      },
      “name”: “ubuntu-xenial”,
      “containerized”: false,
      “hostname”: “ubuntu-xenial”
    }
  },
  “fields”: {
    “@timestamp”: [
      “2019-09-12T14:57:18.195Z”
    ],
    “suricata.eve.timestamp”: [
      “2019-09-12T14:57:18.195Z”
    ]
  },
  “sort”: [
    1568300238195
  ]
}

This meant that, enhancing the export data, by adding some extra fields worked.

So now it’s time to conclude this article. I tried out some of the functionality of Elastic Filebeat. Besides log aggregation (getting log information available at a centralized location), I also described how I used filtering and enhancing the exported log data with Filebeat.

In a next article I will also be using Logstash between Filebeat and ElastSearch.

The post Using Elastic Stack, Filebeat (for log aggregation) appeared first on AMIS Oracle and Java Blog.


Downsizing the Data Set – Resampling and Binning of Time Series and other Data Sets

$
0
0

Data Sets are often too small. We do not have all data that we need in order to interpret, explain, visualize or use for training a meaningful model. However, quite often our data sets are too large. Or, more specifically, they have higher resolution than is necessary or even than is desirable. We may have a timeseries with values for every other second, although meaningful changes do not happen at lower frequencies than 30 seconds or even much longer. We may have measurements for each meter for a metric that does not vary meaningfully at less than 50 meters.

Having data at too high a resolution is not a good thing. For one, a large data set may be quite unwieldy to work with. It is too big for our algorithms and equipment. Furthermore, high resolution data may contain meaningless twitching, local noise that may impact our findings. And of course we may have values along a continuous axis, a floating point range that holds values with several apparently significant digits that are not really significant at all. We cannot meaningfully measure temperature or distance in mili-degrees or micrometers. Ideally, we work with values at meaningful values and only significant digits. When we are really only interested in comparison and similarity detection, we can frequently settle for even less specific values – as the SAX algorithm for example implements.

In many cases, we (should) want to lower the resolution of our data set, quite possibly along two axes: the X-axis (time, distance, simply count of measurement) and the Y-axis (the signal value).

I will assume in this article that we work with data in Pandas (in the context of Jupyter Notebooks running a Python kernel). And I will show some simple examples of reducing the size of the dataset without loss of meaningful information. The sources for this article are on GitHub: https://github.com/lucasjellema/data-analytic-explorations/tree/master/around-the-fort .

For this example, I will work with a data set collected by Strava, representing a walk that lasted for about one hour and close to 5 km. The Strava data set contains over 1300 observations – each recording longitude and latitude, altitude, distance and speed. imageThese measurements are taken about every 2-4 seconds. This results in a high res chart when plotted using plotly express:

fig = px.scatter(s, x=”time”, y=”altitude”, title=’Altitude vs Distance in our Walk Around the Fort’, render_mode=’svg’)
fig.show()

SNAGHTML10ac7cc9

Here I have shown both a scatter and a line chart. Both contain over 1300 values.

For my purposes, I do not need data at this high resolution. In fact, the variation in walking speed is quite high within 30 second periods, but not in a meaningful way. I prefer to have values smoothed over 30 minutes or longer. Note: I am primarily interested in altitude measurements, so let’s focus on that.

I will discuss three methods for horizontal resolution:  resample for timeseries, DIY grouping and aggregating for any data series and PAA (piecewise aggregate approximation). Next, we will talk about vertical resolution reduction; we will look at quantiles, equi-height binning and symbolic representation through SAX.

Horizontal Reduction of Resolution

When we are dealing with a time series, it is easy to change the resolution of the data set, simply by resampling on the Data Frame. Let’s say we take the average of the altitude over each 30 second window. That is done as easy as:

a = dataFrame.resample(’30S’).mean()[‘altitude’].to_frame(name=’altitude’)

However, in this case the index of our data set is not actually a timestamp. One of the dimensions is time, another is distance. It seems most appropriate to sample the set of altitude values by distance. Taking the altitude once every 25 meters (an average for all measurements in each 25 meter section) seems quite enough.

This can be done I am sure in several ways. The one I show here takes two steps:

  • assign a distance window to each observation (into which 25 meter window does each observation go)
  • what is the average altitude value for all observations in each window

The code for this:

distance_window_width = 25
s[‘distance_window’] = s[‘distance’].apply(lambda distance: distance_window_width*(round(distance/distance_window_width)))

image

And subsequently the aggregation:

d = s[[‘altitude’,’distance_window’]].copy().groupby(s[‘distance_window’]).mean()

image

In a chart we can see the effect of the reduction of the data resolution – first a line chart (with interpolation) then a bar chart that is a better representation of the data set as it currently stands – small windows for which average values have been calculated.

image

At this point we have smoothed the curve – averaged out small fluctuations. Instead of taking the average, we could consider other methods of determining the value to represent a window – modus is one option, median another and explicit exclusion of outliers yet another option.

PAA – Piecewise Aggregate Approximation

A popular way of reducing the horizontal resolution of data sets is PAA (piecewise aggregate approximation). In essence, it looks at data per window and calculates the value representing that window, just as we have been doing with our simple averaging.

It is worthwhile to read through some of the PAA resources. Here I will just show how to leverage a Python library that implements PAA or how to create a PAA function (from code from such a library) and invoke it for resolution reduction.

I have created a function paa – the code was copied from https://github.com/seninp/saxpy/blob/master/saxpy/paa.py.

#use PAA for lowering the data set’s resolution
# taken from https://github.com/seninp/saxpy/blob/master/saxpy/paa.py
def paa(series, paa_segments):
     “””PAA implementation.”””
     series_len = len(series)

    # check for the trivial case
     if (series_len == paa_segments):
         return np.copy(series)
     else:
         res = np.zeros(paa_segments)
         # check when we are even
         if (series_len % paa_segments == 0):
             inc = series_len // paa_segments
             for i in range(0, series_len):
                 idx = i // inc
                 np.add.at(res, idx, series[i])
                 # res[idx] = res[idx] + series[i]
             return res / inc
         # and process when we are odd
         else:
             for i in range(0, paa_segments * series_len):
                 idx = i // series_len
                 pos = i // paa_segments
                 np.add.at(res, idx, series[pos])
                 # res[idx] = res[idx] + series[pos]
             return res / series_len

With this function in my Notebook, I can create a low res data set with PAA like this (note that I have full control of the number windows or segments the PAA result should have):

# to bring down the number of data points from 1300 to a much lower number, use the PAA algorithm like this:
e = paa(series = s[‘altitude’], paa_segments = 130)
# create Pandas data frame from  numpy.ndarray
de = pd.DataFrame(data=e[:],    # values
               index=e[:],    # 1st column as index
               columns=[‘altitude’]
                  )
# add an column x that has its values set to the row index of each row
de[‘x’] = range(1, len(de) + 1)

 image

Vertical Reduction of Resolution

The altitude values calculated for each 25 meter distance window is on a continuous scale. Each value can differ from all other values and is expressed as a floating point number with many decimal digits. Of course these values are only crude estimates of the actual altitude in real life. The GPS facilities in my smartphone do not allow for fine grained altitude determination. So pretending the altitude for each horizontal window is known in great detail is not meaningful.

There are several ways of dealing with this continuous value range. By simply rounding values we can at least get rid of misleading decimal digits. We can further reduce resolution by creating a fixed number of value ranges or bins (or value categories) and assigning each window to a bin or category. This enormously simplifies our data set to a level where calculations seems quite crude – but are perhaps more honest. For making comparisons between signals and finding repeating patterns and other similarities, such a simplification is frequently not only justified but even a cause for faster as well as better results.

A simple approach would be to decide on a small number of altitude levels – say six different levels – and assigning each value to one of these six levels. Pandas have the qcut function that we can leverage (this assigns the quantile to each record, attempting to get equal numbers of records into each quantile resulting in quantiles or bins that do cover different value ranges):

number_of_bins = 6
d[‘altitude_bin’] = pd.qcut(d[‘altitude’], number_of_bins,labels=False)

image

The corresponding bar chart that shows all bin values looks as follows:

image

If we want to have the altitude value at the start of the bin to which an observation is assigned, here is what we can do:

number_of_bins = 6
d[‘altitude_bin’] = pd.qcut(d[‘altitude’], number_of_bins,labels=False)
categories, edges = pd.qcut(d[‘altitude’], number_of_bins, retbins=True, labels=False)
df = pd.DataFrame({‘original_altitude’:d[‘altitude’],
                    ‘altitude_bin’: edges[1:][categories]},
                   columns = [‘original_altitude’, ‘altitude_bin’])
df[‘altitude_bin’].value_counts()

image

Instead of quantiles with each the same number of values, we can use bins that each cover the same value distance – say each 50 cm altitude. In Pandas this can be done by using the function cut instead of qcut:

number_of_bins = 6
d[‘altitude_bin’] = pd.cut(d[‘altitude’], number_of_bins,labels=False)

Almost the same code, assigning bin index values to each record, based on bins that each cover the same amount of altitude.

In a bar chart, this is what the altitude bin (labeled 0 through 5, these are unit less labels) vs distance looks like:

image

You can find out the bin ranges quite easily:

number_of_bins = 6
d[‘altitude_bin’] = pd.cut(d[‘altitude’], number_of_bins)
d[‘altitude_bin’].value_counts(sort=False)

image

Symbolic Representation – SAX

The bin labels in the previous section may appear like measurements with being numeric and all. But in fact they are unit less labels. They could have been labeled A through F. They are ordered but have no size associated with them.

The concept of symbolic representation of time series (and using that compact representation for efficient similarity analysis) has been researched extensively. The most prominent theory in this field to date is called SAX – Symbolic Aggregate approXimation. It also assigns labels to each observed value – going about it in a slightly more subtle way than using equiheight bins or quantiles. Check out one of the many resources on SAX – for example starting from here: https://www.cs.ucr.edu/~eamonn/SAX.htm.

To create a SAX representation of our walk around the fort is not very hard at all.

# how many different categories to use or how many letters in the SAX alphabet
alphabet_size = 7
# normalize the altitude data series
data_znorm = znorm(s[‘altitude’])
# use PAA for horizontal resolution reduction from 1300+ data points to 130 segments
# Note: this is a fairly slow step
data_paa = paa(data_znorm, 130)
# create the SAX representation for the 130 data points
sax_representation_altitude_series = ts_to_string(data_paa, cuts_for_asize(alphabet_size))
sax_representation_altitude_series

image

What started out as a set of 1300+ floating point values has now been reduced to a string with 130 characters (basically the set fits in 130 * 3 bits). Did we lose information? Well, we gave up on a lot of fake accuracy. And for many purposes, this resolution of our data set is quite enough. Looking for repeating patterns for example. It would seem that “ddddddccccccccaaaabbb” is a nicely repeating pattern. Four times? We did four laps around the fort!

Here is the bar chart that visualizes the SAX pattern. Not unlike the previous bar charts – yet even further condensed.

image

Resources

The sources for this article are on GitHub: https://github.com/lucasjellema/data-analytic-explorations/tree/master/around-the-fort .

The post Downsizing the Data Set – Resampling and Binning of Time Series and other Data Sets appeared first on AMIS Oracle and Java Blog.

Highlights from Oracle OpenWorld 2019 – Larry Ellison’s Key-Notes

$
0
0

imageThis article gives some brief and key insights in Larry Ellison’s keynote presentation on Oracle Cloud Infrastructure at Oracle OpenWorld 2019.

Note the new mission statement for Oracle:

Our mission is to help people see data in new ways, discover insights, unlock endless possibilities.

Autonomous was the key word of the conference. Not just Autonomous Database, but also Autonomous OS (Linux) and ultimately Autonomous Cloud. Autonomous refers to elimination of human labor (configuration and management) by leveraging Machine Learning and automating tasks that are currently manual. This reduces costs (the costs of human assets by far outweighs the cost of physical resources). And it reduces risk by eliminating human error and (human) data theft. And it ensures that activities are performed faster and without missing a system when patching.

The (Oracle) Gen2 Cloud aka Oracle Cloud Infrastructure removes human labor and therefore human error and potential data loss.

image

Larry kept pounding on AWS – positioning Oracle as the modern cloud provider (gen 2) as well as the true Enterprise level technology and service provider.

Larry also positioned the Oracle Database as the single converged database the only one you need [instead of five different database for different workloads and different types of data]; Oracle Database does relational as well as JSON and XML and Graph; it runs OLTP and OLAP and Machine Learning/Advanced Analytics; it does columnar, row level, in memory; it stores blockchain transactions (this was new to me). Evolving and autonomizing one database is far less work than trying to do so for five different database services [as AWS has to do].

image

Larry suggests that because a smart phone is a converged machine (telephone, email device, music player, camera, …), your database better be a converged system as well.

image

image

Larry claims again: “you got to be willing to pay less” – that Oracle Autonomous Database is “way cheaper and way safer” than any of the Amazon databases. Part of the reason is the reduction of human administration effort. Other aspects: auto-scale (pay for actual usage by the hour, dynamic scaling without downtime) and faster processing. “We’ll guarantee your Amazon bill will go in half”

image

Autonomous Database can start in fairly small configuration:

image

Announcing: Oracle Data Safe

– see: https://www.oracle.com/database/technologies/security/data-safe.html

Data Safe is a unified control center for your Oracle Databases which helps you understand the sensitivity of your data, evaluate risks to data, mask sensitive data, implement and monitor security controls, assess user security, monitor user activity, and address data security compliance requirements. Whether you’re using Oracle Autonomous Database or Oracle Database Cloud Service (Exadata, Virtual Machine, or Bare Metal), Data Safe delivers essential data security capabilities as a service on Oracle Cloud Infrastructure – at no extra cost.

image

Announcing: Autonomous Linux –

(see: https://www.oracle.com/cloud/compute/autonomous-linux.html)

the no downtime auto fix OS, based to a large degree on the KSplice technology. Note: Oracle started in the Linux business in 1998 and started selling Enterprise Linux in 2006.

image

Announcing Exadata X8M

Exadata X8M – M for Memory (or really Persistent Memory, a new Intel feature) Super low latency data access, also RoCE (even faster than Infiniband)

image

Comparing Exadata X8M to All Flash memory configurations on AWS and Azure:

image

Announcing OCI Next Generation Storage Platform

image

Announcing: Building the relationship with Microsoft

Oracle and Microsoft are working closely together. Offering direct and fast connections (high speed link) between Azure and OCI data centers and services. And Oracle offering Microsoft products on their OCI cloud – even the Microsoft SQL Server database. Keep your enemies closer still? Or really good friends? For example: Microsoft Analytics on Oracle Autonomous Database

image

image

SQL Server on OCI (later also Windows Server)

intertwined data centers (North East US – Virginia, London, Asia and Europe to follow)

“Microsoft have a lot of good technology” says Larry. He really did.

Data Centers – Global Footprint – expanding from 16 regions to 25 late 2020

Current data centers:

image

End of 2020, the data centers will be distributed as follows (also note the OCI-Azure interconnects):

image

New User Experience Design : Redwood UX

Redwood – New User Experience Design – that shows up everywhere. A rebranded Oracle and a new UX design. And a new mission statement written by founder Larry Ellison: “Our mission is to help people see data in new ways, discover insights, unlock endless possibilities.”

The design has less of the ‘agressive’ red, a friendlier font in the titles of powerpoint slides and new colors, new shapes, new interaction flows. This design has influenced the UI of Oracle Cloud, the corporate website and it will influence the UX of all Oracle Applications (SaaS and on premises). Read for example this article.

image

image

The folding UI:

image

Nice visualization: show all my connections in the enterprise in the org chart as well as on a geographic map

image

Marketplace Paid Listings

Pay for third party applications (SaaaS) offerings using Oracle Cloud Universal Credits – read this. Simply put: you consume an ISVs service running on Oracle Cloud Infrastructure and payment is handled by Oracle on behalf of that 3rd party. Convenient for the customer  (single bundle of cloud credits) and especially for the 3rd party (leverage Oracle Cloud’s metering and billing process and mechanism).

The Oracle Cloud Marketplace provides a single platform where customers can discover, evaluate, and launch a rich ecosystem of click-to-deploy images and end-to-end solution stacks provided by Oracle and independent software vendor (ISV) partners.
The latest enhancement to the Oracle Cloud Marketplace: the ability to bill on behalf of partners through the Marketplace. With an Oracle Cloud Marketplace “paid listing” capability, customers can now consume the ISV solutions of their choice and receive a single, consolidated bill for these solutions and Oracle Cloud Infrastructure services.

image

VM Ware – lift and shift (in tact) to Oracle Cloud – where Ravello has taken us?

image

One More Announcement: Oracle Cloud [forever] Free Tier

A request we Groundbreaker ambassadors have been making for many years now: provide a free tier in Oracle Cloud. Minimum set of resources, limited compute and memory and storage that is fine. But something that does not expire after 30 days. Something that allows developers to work on a project for a prolonged period of time and to actually run simple applications. And now, finally, it has been announced. And better than that: it has been delivered. I just got my free tier Autonomous Data Warehouse Cloud up and running in about 10 minutes.

Larry Ellison stated: “We want to get developers from all over the world – to be able to try out and prototype their ideas. Students, enterprise employees and everyone else. It is free – for an unlimited time.”

image

Always free – it seems a promise (see: https://www.oracle.com/cloud/free/ and for some details: https://blogs.oracle.com/oracle-database/freedom-to-build-announcing-oracle-cloud-free-tier-with-new-always-free-services-and-always-free-oracle-autonomous-database ; read the Free Tier FAQ). The free tier includes database as well as Compute VMs, ample Storage, networking and monitoring facilities:

Specifications include:

  • 2 Autonomous Databases (Autonomous Data Warehouse or Autonomous Transaction Processing), each with 1 OCPU and 20 GB storage
  • 2 Compute VMs, each with 1/8 OCPU and 1 GB memory
  • 2 Block Volumes, 100 GB total, with up to 5 free backups
  • 10 GB Object Storage, 10 GB Archive Storage, and 50,000/month API requests
  • 1 Load Balancer, 10 Mbps bandwidth
  • 10 TB/month Outbound Data Transfer
  • 500 million ingestion Datapoints and 1 billion Datapoints for Monitoring Service
  • 1 million Notification delivery options per month and 1000 emails per month

image

Not specifically part of the Free Tier – but quite free as well are the first 2 million Function calls on Oracle [serverless] Functions: see https://www.oracle.com/cloud/cloud-native/functions/ 

Always Free includes Oracle Autonomous Database – running on Exadata

imageQuick comparison to AWS:

image


Resources

On Demand Videos from Oracle Open World 2019: https://www.oracle.com/openworld/on-demand.html

The post Highlights from Oracle OpenWorld 2019 – Larry Ellison’s Key-Notes appeared first on AMIS Oracle and Java Blog.

AndrIoT, an internet of things enabled phone, part 1

$
0
0

Our mobile phone these days are real powerhouses! They are packed with tons of connectivity, cpu power, ram, storage and…….Sensors!!!!

And the latter is exactly what we need in IoT, combined with connectivity makes them really usefull for all kinds of tests, workshops and POC’s.

But how can we use all those features and make sure that data is dumped in whatever cloud solution you pursue?

In this series we will build up the phone software and add all kinds of features to our solution so it can be a quickstarter for any future endeavours.

STEP 1, to android or not to android, that the question?

Is your phone an ANDROID phone? If not, stop, and never look back!

If so, be adviced that Android phone offer a decent amount of flexibility, but suffer from standardization because of that.

Make sure your phone is recent phone with a recent OS version. You need the don’t latest, an 5 year old phone will do the trick probably. The version of android must be +4.4. The sensors differ from phone to phone, so although you might end up with a working solution, the lack of sensors can hold you back.

STEP 2, be aware!

All the apps are available on the official Google Play Store, and your phone doesn’t need any ROOT access. But, some of the apps require some money (as in 2$). Developers need to make a living too! But you might be curious if it really works, and don’t want to make an investment yet. Then we need a different app store! The F-droid app store isn’t illegal or anything, but there might be a risk involved for ransomware etc. due to the ‘side-loading feature’ that needs to be enabled. 

You wanna have F-Droid, take STEP 3, else go to STEP 4!

STEP 3, install F-Droid

Allow software from unknown source in Android Settings menu, see https://www.androidcentral.com/unknown-sources

So F-droid is what we need, go to https://f-droid.org/

Download and install the APK

Open the app! 

STEP 4, install all apps

If you didn’t install F-droid, go the Google App Store

Install the following apps:

When the Termux apps are installed, we need to go to the Google Play Store, and install:

So, now we got all the app’s installed, let’s configure them!

STEP 5, configure Teamviewer

Why Teamvier? Well, our IoT solutions are never around the corner, and are tucked away in some dark area where they are hard to reach.

The benefit of Teamviewer is that it can connect through a lot of different situation without any additional configuration. If you don’t require this, than skip this step. SSH might be sufficient for a local connection.

Start Teamviewer host. You need to register to make it available when it’s unattended.

The post AndrIoT, an internet of things enabled phone, part 1 appeared first on AMIS Oracle and Java Blog.

Calling an Oracle DB stored procedure from Spring Boot using Apache Camel

$
0
0

There are different ways to create data services. The choice for a specific technology to use, depends on several factors inside the organisation which wishes to realize these services. In this blog post I’ll provide a minimal example of how you can use Spring Boot with Apache Camel to call an Oracle database procedure which returns the result of an SQL query as an XML. You can browse the code here.

Database

How to get an Oracle DB

Oracle provides many options for obtaining an Oracle database. You can use the Oracle Container Registry (here) or use an XE installation (here). I decided to build my own Docker image this time. This provides a nice and quick way to create and remove databases for development purposes. Oracle provides prepared scripts and Dockerfiles for many products including the database, to get up and running quickly.

  • git clone https://github.com/oracle/docker-images.git
  • cd docker-images/OracleDatabase/SingleInstance/dockerfiles
  • Download the file LINUX.X64_193000_db_home.zip from here and place it in the 19.3.0 folder
  • Build your Docker image: ./buildDockerImage.sh -e -v 19.3.0
  • Create a local folder. for example /home/maarten/dbtmp19c and make sure anyone can read, write, execute to/from/in that folder. The user from the Docker container has a specific userid and by allowing anyone to access it, you avoid problems. This is of course not a secure solution for in production environments! I don’t think you should run an Oracle Database in a Docker container for other then development purposes. Consider licensing and patching requirements.
  • Create and run your database. The first time it takes a while to install everything. The next time you start it is up quickly.
    docker run –name oracle19c -p 1522:1521 -p 5500:5500 -e ORACLE_SID=sid -e ORACLE_PDB=pdb -e ORACLE_PWD=Welcome01 -v /home/maarten/dbtmp19c:/opt/oracle/oradata oracle/database:19.3.0-ee
  • If you want to get rid of the database instance
    (don’t forget the git repo though)
    docker stop oracle19c
    docker rm oracle19c
    docker rmi oracle/database:19.3.0-ee
    rm -rf /home/maarten/dbtmp19c
    Annnnd it’s gone!

Create a user and stored procedure

Now you can access the database with the following credentials (from your host). For example by using SQLDeveloper.

  • Hostname: localhost 
  • Port: 1522 
  • Service: sid 
  • User: system 
  • Password: Welcome01

You can create a testuser with

alter session set container = pdb;

-- USER SQL
CREATE USER testuser IDENTIFIED BY Welcome01
DEFAULT TABLESPACE "USERS"
TEMPORARY TABLESPACE "TEMP";

-- ROLES
GRANT "DBA" TO testuser ;
GRANT "CONNECT" TO testuser;
GRANT "RESOURCE" TO testuser;

Login to the testuser user (notice the service is different)

  • Hostname: localhost 
  • Port: 1522 
  • Service: pdb 
  • User: testuser 
  • Password: Welcome01

Create the following procedure. It returns information of the tables owned by a specified user in XML format.

CREATE OR REPLACE PROCEDURE GET_TABLES 
(
  p_username IN VARCHAR2,RESULT_CLOB OUT CLOB 
) AS
p_query varchar2(1000);
BEGIN
  p_query := 'select * from all_tables where owner='''||p_username||'''';
  select dbms_xmlgen.getxml(p_query) into RESULT_CLOB from dual;
END GET_TABLES;

This is an easy example on how to convert a SELECT statement result to XML in a generic way. If you need to create a specific XML, you can use XMLTRANSFORM or create your XML ‘manually’ with functions like XMLFOREST, XMLAGG, XMLELEMENT, etc.

Data service

In order to create a data service, you need an Oracle JDBC driver to access the database. Luckily, recently, Oracle has put its JDBC driver in Maven central for ease of use. Thank you Kuassi and the other people who have helped making this possible!

        <dependency&gt;
            <groupId&gt;com.oracle.ojdbc</groupId&gt;
            <artifactId&gt;ojdbc8</artifactId&gt;
            <version&gt;19.3.0.0</version&gt;
        </dependency&gt;

The Spring Boot properties which are required to access the database:

  • spring.datasource.url=jdbc:oracle:thin:@localhost:1522/pdb
  • spring.datasource.driver-class-name=oracle.jdbc.OracleDriver
  • spring.datasource.username=testuser
  • spring.datasource.password=Welcome01

The part of the code which actually does the call, prepares the request and returns the result is shown below. 

The template for the call is the following:

sql-stored:get_tables('p_username' VARCHAR ${headers.username},OUT CLOB result_clob)?dataSource=dataSource

The datasource is provided by Spring Boot / Spring JDBC / Hikari CP / Oracle JDBC driver. You get that one for free if you include the relevant dependencies and provide configuration. The format of the template is described here. The example illustrates how to get parameters in and how to get them out again. It also shows how to convert a Clob to text and how to set the body to a specific return variable.

Please mind that if the query does not return any results, the OUT variable is Null. Thus getting anything from that object will cause a NullpointerException. Do not use this code as-is! It is only a minimal example

You can look at the complete example here and build it with maven clean package. The resulting JAR can be run with java -jar camel-springboot-oracle-dataservice-0.0.1-SNAPSHOT.jar. 

Calling the service

The REST service is created with the following code:

It responds to a GET call at http://localhost:8081/camel/api/in

Finally

Benefits

Creating data services using Spring Boot with Apache Camel has several benefits:

  • Spring and Spring Boot are popular in the Java world. Spring is a very extensive framework providing a lot of functionality ranging from security, monitoring, to implementing REST services and many other things. Spring Boot makes it easy to use Spring.
  • There are many components available for Apache Camel which allow integration with diverse systems. If the component you need is not there, or you need specific functionality which is not provided, you can benefit from Apache Camel being open source.
  • Spring, Spring Boot and Apache Camel are solid choices which have been worked at for many years by many people and are proven for production use. They both have large communities and many users. A lot of documentation and help is available. You won’t get stuck easily.

There is a good chance that when implementing these 2 together, You won’t need much more for your integration needs. In addition, individual services scale a lot better and usually have a lighter footprint than for example an integration product running on an application server platform.

Considerations

There are some things to consider when to using these products such as;

  • Spring / Spring Boot do not (yet) support GraalVMs native compilation out of the box. When running on a cloud environment and memory usage or start-up time matter, you could save money by for example implementing Quarkus or Micronaut. Spring will support GraalVM out of the box in version 5.3 expected Q2 2020 (see here). Quarkus has several Camel extensions available but not the camel-sql extension since that is based on spring-jdbc.
  • This example might require specific code per service (depending on your database code). This is custom code you need to maintain and might have overhead (build jobs, Git repositories, etc). You could consider implementing a dispatcher within the database to reduce the amount of required services. See my blog post on this here (consider not using the Oracle object types for simplicity). Then however you would be adhering to the ‘thick database paradigm’ which might not suite your tastes and might cause a vendor lock-in if you start depending on PL/SQL too much. The dispatcher solution is likely not to be portable to other databases.
  • For REST services on Oracle databases, implementing Oracle REST Data Services is also a viable and powerful option. Although it can do more, it is most suitable for REST services and only on Oracle databases. If you want to provide SOAP services or are also working with other flavors of databases, you might want to reduce the amount of different technologies used for data services to allow for platform consolidation and make your LCM challenges not harder than they already might be.

The post Calling an Oracle DB stored procedure from Spring Boot using Apache Camel appeared first on AMIS Oracle and Java Blog.

Deploying an Oracle WebLogic Domain on a Kubernetes cluster using Oracle WebLogic Server Kubernetes Operator

$
0
0

At the Oracle Partner PaaS Summer Camp IX 2019 in Lisbon, held at the end of August, I followed a 5 day during workshop called “Modern Application Development with Oracle Cloud”. In this workshop, on day 4, the topic was “WebLogic on Kubernetes”.
[https://paascommunity.com/2019/09/02/oracle-paas-summer-camp-2019-results-become-a-trained-certified-oracle-cloud-platform-expert/]

At the Summer Camp we used a free Oracle Cloud trial account.

On day 4, I did a hands-on lab in which an Oracle WebLogic Domain was deployed on an Oracle Container Engine for Kubernetes (OKE) cluster using Oracle WebLogic Server Kubernetes Operator.

In this article, I will describe the steps that I went through to get an Oracle WebLogic Domain running on a three-node Kubernetes cluster instance (provisioned by OKE) on Oracle Cloud Infrastructure (OCI) in an existing OCI tenancy.

Oracle Container Engine for Kubernetes (OKE)

Oracle Container Engine for Kubernetes (OKE) is a fully-managed, scalable, and highly available service that you can use to deploy your containerized applications to the cloud. Use OKE when your development team wants to reliably build, deploy, and manage cloud-native applications. You specify the compute resources that your applications require, and OKE provisions them on Oracle Cloud Infrastructure (OCI) in an existing OCI tenancy.

Container Engine for Kubernetes uses Kubernetes – the open-source system for automating deployment, scaling, and management of containerized applications across clusters of hosts. Kubernetes groups the containers that make up an application into logical units (called pods) for easy management and discovery. Container Engine for Kubernetes uses versions of Kubernetes certified as conformant by the Cloud Native Computing Foundation (CNCF).

You can access Container Engine for Kubernetes to define and create Kubernetes clusters using the Console and the REST API. You can access the clusters you create using the Kubernetes command line (kubectl), the Kubernetes Dashboard, and the Kubernetes API.

Container Engine for Kubernetes is integrated with Oracle Cloud Infrastructure Identity and Access Management (IAM), which provides easy authentication with native Oracle Cloud Infrastructure identity functionality.
[https://docs.cloud.oracle.com/iaas/Content/ContEng/Concepts/contengoverview.htm]

Oracle Cloud Infrastructure (OCI)

Oracle Cloud Infrastructure is a set of complementary cloud services that enable you to build and run a wide range of applications and services in a highly available hosted environment. Oracle Cloud Infrastructure offers high-performance compute capabilities (as physical hardware instances) and storage capacity in a flexible overlay virtual network that is securely accessible from your on-premises network.
[https://docs.cloud.oracle.com/iaas/Content/GSG/Concepts/baremetalintro.htm]

In order to get an Oracle WebLogic Domain running on a Kubernetes cluster instance (provisioned by OKE) on Oracle Cloud Infrastructure (OCI) in an existing OCI tenancy, a number of steps have to be taken.

Also, some tools (like kubectl) will be used. At the Summer Camp our instructors provided us with a VirtualBox appliance for this.

For OKE cluster creation, I used the Quick Create feature, which uses default settings to create a quick cluster with new network resources as required. This approach is the fastest way to create a new cluster. If you accept all the default values, you can create a new cluster in just a few clicks. New network resources for the cluster are created automatically, along with a node pool and three worker nodes. All the nodes will be deployed in different Availability Domains to ensure high availability.

These are the steps that I took:

  • Creating a Policy (allow service OKE to manage all-resources in tenancy)
  • Creating an OKE (Oracle Container Engine for Kubernetes) cluster, including network resources (VCN, Subnets, Security lists, etc.) and a Node Pool (with three nodes)
  • Configuring OCI CLI
  • Creating an OCI CLI config file using a setup dialog
  • Uploading the public key of the API signing key pair
  • Setting up the RBAC policy for the OKE cluster
  • Installing and configuring Oracle WebLogic Server Kubernetes Operator
  • Installing the “operator” with a Helm chart
  • Installing and configuring Traefik with a Helm chart
  • Deploying a WebLogic domain
  • Opening the Oracle WebLogic Server Administration Console
  • Testing the demo web application
  • Opening the Kubernetes Web UI (Dashboard)

In the overview below you can see a number of these steps:

I logged in to my Oracle Cloud environment.

Then the Infrastructure Classic Console page is opened were you can check the overall status of your purchased services and manage your accounts or subscriptions.

I clicked on “Compute”.

In the page “Service: Oracle Cloud Infrastructure”, I clicked on button “Open Service Console”.

In the OCI console, the Oracle Cloud Infrastructure Compute page was opened, which lets you provision and manage compute hosts, known as instances.

Creating a Policy

In the OCI console, I opened the navigation menu and clicked on Governance and Administration | Identity | Policies.

There I selected in the left-hand side menu the “root” compartment for my account, and I clicked on button “Create Policy”.

I entered the following values:

Name

A unique name for the policy. The name must be unique across all policies in your tenancy. You cannot change this later.

WebLogick8sPolicy
Description

A friendly description.

Allow OKE to manage resources
Policy Versioning KEEP POLICY CURRENT

This ensures that the policy stays current with any future changes to the service’s definitions of verbs and resources.

Statement allow service OKE to manage all-resources in tenancy
Tags

I didn’t apply tags.

I clicked on button “Create”.

Creating an OKE (Oracle Container Engine for Kubernetes) cluster

In the OCI console, I opened the navigation menu and clicked on Solutions and Platform | Developer Services | Container Clusters (OKE).

On the Cluster List page, I clicked on button “Create Cluster”.

I entered the following values:

Name

The name of the new cluster.

clusterAMISMLA1
Kubernetes Version

The Kubernetes version that runs on the master nodes and worker nodes of the cluster.

v1.13.5

I selected the latest version.

Quick or Custom Create QUICK CREATE

This creates a new cluster with default settings, along with new network resources for the new cluster. The Create Virtual Cloud Network panel shows the network resources that will be created for you by default, namely a VCN, two load balancer subnets, and three worker node subnets.

Create Virtual Cloud Network:
Compartment

The compartment in which the network resources will be created.

marclameriks1(root)
Resource Creation 1 VCN, 1 service lb subnet and 1 worker node subset
Private or Public PRIVATE

The Kubernetes worker nodes that are created will be hosted in private subnet(s).

Create Node Pool:

The Create Node Pool panel shows the fixed properties of the first node pool in the cluster that will be created for you.


The Create Node Pool panel also contains some node pool properties that you can change.

Name

The name of the node pool.

pool1
Compartment

The compartment in which the node pool will be created (always the same as the one in which the new network resources will reside).

amismarclameriks1(root)
Version

The version of Kubernetes that will run on each worker node in the node pool (always the same as the version specified for the master nodes).

V1.13.5
Image

The image to use on each node in the node pool.

Oracle-Linux-7.6
Shape

The shape to use for each node in the node pool. The shape determines the number of CPUs and the amount of memory allocated to each node. The list shows only those shapes available in your tenancy that are supported by Container Engine for Kubernetes.

VM.Standard2.1
Number of nodes

The number of nodes in the node pool.

3
Public SSH Key

I left this field empty.

Kubernetes Labels Key: name
Value: pool1
Additional Add Ons:
Kubernetes Dashboard Enabled
Tiller (Helm) Enabled

I clicked on button “Create”, to create the new network resources and the new cluster.

I clicked on the link “clusterAMISMLA1” to show the cluster details.

So, by selecting the Quick Create, the new cluster (clusterAMISMLA1) with default settings was created, along with new network resources (namely a VCN, two load balancer subnets, and three worker node subnets).

Configuring OCI CLI

Before the OCI CLI can be used, some necessary information has to be collected using the OCI console:

  • User OCID

In the OCI console I clicked on my OCI user name and selected ‘User Settings”.

On the User Details page, under tab “User Information”, you can find the User OCID. I clicked on link “Copy” and pasted it temporary to a text editor.

OCID: ocid1.user.oc1..aaaaaaaa111…111q

  • Tenancy OCID

In the OCI console, I opened the navigation menu and clicked on Governance and Administration | Administration | Tenancy Details.

On the Tenancy Details page, under tab “Tenancy Information”, you can find the Tenancy OCID. I clicked on link “Copy” and pasted it temporary to a text editor.

OCID: ocid1.tenancy.oc1..aaaaaaaa111…111q

  • Region

On the Tenancy Details page, under “Regions” you can find the current Region Identifier (in my case: eu-frankfurt-1).

Command Line Interface (CLI)

The CLI is a tool that lets you work with most of the available services in Oracle Cloud Infrastructure. The CLI provides the same core functionality as the Console, plus additional commands. The CLI’s functionality and command help are based on the service’s API.
[https://docs.cloud.oracle.com/iaas/Content/GSG/Tasks/gettingstartedwiththeCLI.htm]

If you need to install OCI CLI then follow the documentation:
https://docs.cloud.oracle.com/iaas/Content/API/SDKDocs/cliinstall.htm

Before using the CLI, you must create a config file that contains the required credentials for working with Oracle Cloud Infrastructure. You can create this file using a setup dialog or manually using a text editor.
[https://docs.cloud.oracle.com/iaas/Content/API/SDKDocs/cliinstall.htm]

Creating an OCI CLI config file using a setup dialog

To have the CLI walk me through the first-time setup process, I used the oci setup config command. The command prompts you for the information required for the config file and the API public/private keys. The setup dialog generates an API key pair and creates the config file.

At the Summer Camp, our instructors provided us with a VirtualBox appliance, that contained the necessary tools.

I opened a Terminal and typed the following command to create a valid OCI CLI config file. I provided the information asked by the wizard (including a new passphrase for my private key):

oci setup config

With the following output:

This command provides a walkthrough of creating a valid CLI config file.

The following links explain where to find the information required by this
script:

User OCID and Tenancy OCID:

https://docs.cloud.oracle.com/Content/API/Concepts/apisigningkey.htm#Other

Region:

https://docs.cloud.oracle.com/Content/General/Concepts/regions.htm

General config documentation:

https://docs.cloud.oracle.com/Content/API/Concepts/sdkconfig.htm

Enter a location for your config [/home/oracle/.oci/config]:
Enter a user OCID:
ocid1.user.oc1..aaaaaaaa111…111q
Enter a tenancy OCID:
ocid1.tenancy.oc1..aaaaaaaa111…111q
Enter a region (e.g. ap-mumbai-1, ap-seoul-1, ap-tokyo-1, ca-toronto-1, eu-frankfurt-1, eu-zurich-1, sa-saopaulo-1, uk-london-1, us-ashburn-1, us-gov-ashburn-1, us-gov-chicago-1, us-gov-phoenix-1, us-langley-1, us-luke-1, us-phoenix-1):
eu-frankfurt-1
Do you want to generate a new RSA key pair? (If you decline you will be asked to supply the path to an existing key.) [Y/n]: Y
Enter a directory for your keys to be created [/home/oracle/.oci]:
Enter a name for your key [oci_api_key]:
Public key written to: /home/oracle/.oci/oci_api_key_public.pem
Enter a passphrase for your private key (empty for no passphrase):
Private key written to: /home/oracle/.oci/oci_api_key.pem
Fingerprint: 1c:7b:111..111:a1
Config written to /home/oracle/.oci/config

If you haven’t already uploaded your public key through the console,
follow the instructions on the page linked below in the section ‘How to
upload the public key’:


https://docs.cloud.oracle.com/Content/API/Concepts/apisigningkey.htm#How2

I checked the files in directory /home/oracle/.oci:

  • config


[DEFAULT]
user=
ocid1.user.oc1..aaaaaaaa111…111q
fingerprint=1c:7b:111..111:a1
key_file=/home/oracle/.oci/oci_api_key.pem
tenancy=
ocid1.tenancy.oc1..aaaaaaaa111…111q
region=
eu-frankfurt-1

  • oci_api_key.pem


—–BEGIN RSA PRIVATE KEY—–
MIIEpAIBAAKCAQEAxfonSva57bhbf+l8WWkHjcwOXnqpUF11bN+zW+uid/N6shHu

pcQuX0PgnyZVy8UEp13+zMz3nflbZRxdp/KcJj+OmzG4aoGEeDFxCQ==
—–END RSA PRIVATE KEY—–

  • oci_api_key_public.pem


—–BEGIN PUBLIC KEY—–
MIIBIjANBgkqhkiG9w0BAQEFAAOCAQ8AMIIBCgKCAQEAxfonSva57bhbf+l8WWkH
jcwOXnqpUF11bN+zW+uid/N6shHunleyss2I6JHsLnTqqdLIgXTTL2NpJd2b1vIj
iI/XJ9WacEq5GZB6FDDUpIOge15kVU/f1jPkJv1xiWQNi/SgllI49GggrRdKlf2a
6VI4e8jbBN+Ej7uA83FQ1PgC0GU9H0NX7H1z2e3xcRiXca0hBfnXUh0yobzKyb/d
sL0+6xsdPJoLP0HP3nIXGuml6oASaDY4Q4VKBkgag8Pmre9q+UKYt8UOcPxx3W7F
Ug3uAjQRQBtqYPu0mlezCcfnmq3h/ILRgHd7KAJZH+6hzJqhcrjry8+fn0PD7IC+
0wIDAQAB
—–END PUBLIC KEY—–

Uploading the public key of the API signing key pair

The final step to complete the OCI CLI setup is to upload the freshly generated public key through the console.

In the OCI console I clicked on my OCI user name and selected “User Settings”. On the User Details page, under tab “User Information”, I clicked on button “Add Public Key” and copied the content of the oci_api_key_public.pem file into the PUBLIC KEY text area. Then I clicked on button “Add”.

The key was uploaded and its fingerprint is displayed in the list.

In the OCI console, I opened the navigation menu and clicked on Solutions and Platform | Developer Services | Container Clusters (OKE). I clicked on the link “clusterAMISMLA1”.

Next, I clicked on button “Access Kubeconfig”. A dialog popped up which contained the customized OCI command that I needed to execute to create a Kubernetes configuration file.

In the VirtualBox Appliance, I opened a Terminal and typed the following commands, to create a kubeconfig file for my cluster:

mkdir -p $HOME/.kube
oci ce cluster create-kubeconfig --cluster-id ocid1.cluster.oc1.eu-frankfurt-1.aaaaaaaaa111...111g --file $HOME/.kube/config --region eu-frankfurt-1

With the following output:

New config written to the Kubeconfig file /home/oracle/.kube/config

I checked the files in directory /home/oracle/.kube:

  • config


apiVersion: v1
clusters:
– cluster:
certificate-authority-data: LS0tLS1CRUdJTiBDRVJUSUZJQ0FURS0tLS0tCk1JSURqRENDQW5TZ0F3SUJBZ0lVTC9ueDVGeHJqYXpHSHk1NlV0VS9JK2…
TkQgQ0VSVElGSUNBVEUtLS0tLQo=
server: https://csdsylemnrg.eu-frankfurt-1.clusters.oci.oraclecloud.com:6443
name: cluster-csdsylemnrg
contexts:
– context:
cluster: cluster-csdsylemnrg
user: user-csdsylemnrg
name: context-csdsylemnrg
current-context: context-csdsylemnrg
kind: “”
users:
– name: user-csdsylemnrg
user:
token: eyJoZWFkZXIiOnsiQXV0aG9yaXphdGlvbiI6WyJTaWduYXR1cmUgYWxnb3JpdGhtPVwicnNhLXNoYTI1NlwiLGhlYWRlcn…
aW10ZGdlM3Rhb2p3bWNzZHN5bGVtbnJnL2t1YmVjb25maWcvY29udGVudCJ9

Use kubeconfig files to organize information about clusters, users, namespaces, and authentication mechanisms. The kubectl command-line tool uses kubeconfig files to find the information it needs to choose a cluster and communicate with the API server of a cluster.
By default, kubectl looks for a file named config in the $HOME/.kube directory. You can specify other kubeconfig files by setting the KUBECONFIG environment variable or by setting the –kubeconfig flag.
[https://kubernetes.io/docs/concepts/configuration/organize-cluster-access-kubeconfig/]

If you need to install kubectl then follow the documentation:
https://kubernetes.io/docs/tasks/tools/install-kubectl/

In order to check that kubectl was working correctly, I used the get nodes command:

kubectl get nodes

With the following output:

NAME STATUS ROLES AGE VERSION
10.0.10.2 Ready node 25m v1.13.5
10.0.11.2 Ready node 25m v1.13.5
10.0.12.2 Ready node 25m v1.13.5

Setting up the RBAC policy for the OKE cluster

In order to have permission to access the Kubernetes cluster, I needed to authorize my OCI account as a cluster-admin on the OKE cluster.

I used the following command (which required my User OCID), to create a ClusterRoleBinding for a particular ClusterRole:

kubectl create clusterrolebinding my-cluster-admin-binding --clusterrole=cluster-admin --user=ocid1.user.oc1..aaaaaaaa111...111q

With the following output:

clusterrolebinding “my-cluster-admin-binding” created

For more information about Role-based access control (RBAC) and ClusterRoleBinding, see for example:

https://kubernetes.io/docs/reference/access-authn-authz/rbac/#rolebinding-and-clusterrolebinding

Now, my OCI OKE environment was ready to deploy my WebLogic domain.

Installing and configuring Oracle WebLogic Server Kubernetes Operator

An operator is an application-specific controller that extends Kubernetes to create, configure, and manage instances of complex applications. The Oracle WebLogic Server Kubernetes Operator (the “operator”) follows the standard Kubernetes operator pattern and simplifies the management and operation of WebLogic domains and deployments.


You can have one or more operators in your Kubernetes cluster that manage one or more WebLogic domains each. A Helm chart is provided to manage the installation and configuration of the operator.

[https://oracle.github.io/weblogic-kubernetes-operator/userguide/introduction/introduction/]

Installing the “operator” with a Helm chart

First, clone the Oracle WebLogic Server Kubernetes Operator git repository to your desktop.

git clone https://github.com/oracle/weblogic-kubernetes-operator.git -b 2.0

In order to use Helm to install and manage the operator, you need to ensure that the service account that Tiller uses has the cluster-admin role. The default would be default in namespace kube-system.

I used the following command, to give that service account the necessary permissions:

cat << EOF | kubectl apply -f -
> apiVersion: rbac.authorization.k8s.io/v1
> kind: ClusterRoleBinding
> metadata:
>   name: helm-user-cluster-admin-role
> roleRef:
>   apiGroup: rbac.authorization.k8s.io
>   kind: ClusterRole
>   name: cluster-admin
> subjects:
> - kind: ServiceAccount
>   name: default
>   namespace: kube-system
> EOF

With the following output:

clusterrolebinding “helm-user-cluster-admin-role” created

Kubernetes distinguishes between the concept of a user account and a service account for a number of reasons. The main reason is that user accounts are for humans while service accounts are for processes, which run in pods. Oracle WebLogic Server Kubernetes Operator also requires service accounts. If a service account is not specified, it defaults to default (for example, the namespace’s default service account). If you want to use a different service account, then you must create the operator’s namespace and the service account before installing the “operator” Helm chart.

I used the following command, to create the operator’s namespace:

kubectl create namespace sample-weblogic-operator-ns

With the following output:

namespace “
sample-weblogic-operator-ns” created

I used the following command, to create the service account:

kubectl create serviceaccount -n sample-weblogic-operator-ns sample-weblogic-operator-sa

With the following output:

serviceaccount “
sample-weblogic-operator-sa” created

I used the following commands, to install the “operator” Helm chart:

cd /u01/content/weblogic-kubernetes-operator/
helm install kubernetes/charts/weblogic-operator \
>   --name sample-weblogic-operator \
>   --namespace sample-weblogic-operator-ns \
>   --set image=oracle/weblogic-kubernetes-operator:2.0 \
>   --set serviceAccount=sample-weblogic-operator-sa \
>   --set "domainNamespaces={}"

Remark about the values:

  • name: name of the resource
  • namespace: where the operator gets deployed
  • image: the prebuilt WebLogic Operator 2.0 image. Available on public Docker hub.
  • serviceAccount: service account required to run “operator”
  • domainNamespaces: namespaces where WebLogic domains get deployed in order to control. Note WebLogic domain is not yet deployed so this value will be updated when namespaces created for WebLogic deployment.

With the following output:

NAME: sample-weblogic-operator
LAST DEPLOYED: Thu Aug 29 07:20:02 2019
NAMESPACE:
sample-weblogic-operator-ns
STATUS: DEPLOYED

RESOURCES:
==> v1/ClusterRoleBinding
NAME AGE
sample-weblogic-operator-ns-weblogic-operator-clusterrolebinding-nonresource 1s
sample-weblogic-operator-ns-weblogic-operator-clusterrolebinding-discovery 1s
sample-weblogic-operator-ns-weblogic-operator-clusterrolebinding-auth-delegator 1s
sample-weblogic-operator-ns-weblogic-operator-clusterrolebinding-general 1s

==> v1beta1/Deployment
NAME DESIRED CURRENT UP-TO-DATE AVAILABLE AGE
weblogic-operator 1 1 1 0 1s

==> v1/Pod(related)
NAME READY STATUS RESTARTS AGE
weblogic-operator-848cd6c4cb-rpf9v 0/1 ContainerCreating 0 1s

==> v1/Secret
NAME TYPE DATA AGE
weblogic-operator-secrets Opaque 0 2s

==> v1/ConfigMap
NAME DATA AGE
weblogic-operator-cm 2 2s

==> v1/RoleBinding
NAME AGE
weblogic-operator-rolebinding-namespace 1s
weblogic-operator-rolebinding 1s

==> v1/Service
NAME TYPE CLUSTER-IP EXTERNAL-IP PORT(S) AGE
internal-weblogic-operator-svc ClusterIP 10.96.61.254 8082/TCP 1s

==> v1/ClusterRole
NAME AGE
sample-weblogic-operator-ns-weblogic-operator-clusterrole-nonresource 1s
sample-weblogic-operator-ns-weblogic-operator-clusterrole-namespace 1s
sample-weblogic-operator-ns-weblogic-operator-clusterrole-operator-admin 1s
sample-weblogic-operator-ns-weblogic-operator-clusterrole-domain-admin 1s
sample-weblogic-operator-ns-weblogic-operator-clusterrole-general 1s

==> v1/Role
weblogic-operator-role 1s

I used the following command, to list the Pods:

kubectl get pods -n sample-weblogic-operator-ns

With the following output:

NAME READY STATUS RESTARTS AGE
weblogic-operator-848cd6c4cb-rpf9v 1/1 Running 0 1m

I used the following command, to list the “operator” release:

helm list sample-weblogic-operator

With the following output:

NAME REVISION UPDATED STATUS CHART NAMESPACE
sample-weblogic-operator 1 Thu Aug 29 07:20:02 2019 DEPLOYED weblogic-operator-2
sample-weblogic-operator-ns

So, now the Oracle WebLogic Server Kubernetes Operator had been installed.

Installing and configuring Traefik with a Helm chart

The Oracle WebLogic Server Kubernetes Operator supports three load balancers: Traefik, Voyager, and Apache.

I installed Traefik to provide load balancing for my WebLogic cluster.
[https://docs.traefik.io/]

I used the following commands, to install the Traefik Helm chart:

cd /u01/content/weblogic-kubernetes-operator/
helm install stable/traefik \
> --name traefik-operator \
> --namespace traefik \
> --values kubernetes/samples/charts/traefik/values.yaml  \
> --set "kubernetes.namespaces={traefik}" \
> --set "serviceType=LoadBalancer"

With the following output:

NAME: traefik-operator
LAST DEPLOYED: Thu Aug 29 07:23:26 2019
NAMESPACE:
traefik
STATUS: DEPLOYED

RESOURCES:
==> v1/ConfigMap
NAME DATA AGE
traefik-operator 1 1s
traefik-operator-test 1 1s

==> v1/ServiceAccount
NAME SECRETS AGE
traefik-operator 1 1s

==> v1/ClusterRoleBinding
NAME AGE
traefik-operator 1s

==> v1beta1/Ingress
NAME HOSTS ADDRESS PORTS AGE
traefik-operator-dashboard traefik.example.com 80 1s

==> v1/Secret
NAME TYPE DATA AGE
traefik-operator-default-cert Opaque 2 2s

==> v1/ClusterRole
NAME AGE
traefik-operator 1s

==> v1/Service
NAME TYPE CLUSTER-IP EXTERNAL-IP PORT(S) AGE
traefik-operator-dashboard ClusterIP 10.96.46.6 80/TCP 1s
traefik-operator LoadBalancer 10.96.253.105 80:30542/TCP,443:30638/TCP 1s

==> v1/Deployment
NAME DESIRED CURRENT UP-TO-DATE AVAILABLE AGE
traefik-operator 1 1 1 0 1s

==> v1/Pod(related)
NAME READY STATUS RESTARTS AGE
traefik-operator-7f9c8ff8b8-cqxcf 0/1 ContainerCreating 0 1s

NOTES:

1. Get Traefik’s load balancer IP/hostname:

NOTE: It may take a few minutes for this to become available.

You can watch the status by running:

$ kubectl get svc traefik-operator –namespace traefik -w

Once ‘EXTERNAL-IP’ is no longer ”:

$ kubectl describe svc traefik-operator –namespace traefik | grep Ingress | awk ‘{print $3}’

2. Configure DNS records corresponding to Kubernetes ingress resources to point to the load balancer IP/hostname found in step 1

I used the following command, to list the Services:

kubectl get services -n traefik

With the following output:

NAME TYPE CLUSTER-IP EXTERNAL-IP PORT(S) AGE
traefik-operator
LoadBalancer 10.96.253.105 111.11.11.1 80:30542/TCP,443:30638/TCP 35s
traefik-operator-dashboard ClusterIP 10.96.46.6 80/TCP 35s

Remark about the EXTERNAL-IP of the traefik-operator service:
The EXTERNAL-IP is the Public IP address of the load balancer that I will be using to open the Oracle WebLogic Administration Console.

To print only the Public IP address, you can execute the following command:

kubectl describe svc traefik-operator --namespace traefik | grep Ingress | awk '{print $3}'

With the following output:

111.11.11.1

I used the following command, to lists all of the releases:

helm list

With the following output:

NAME REVISION UPDATED STATUS CHART NAMESPACE
sample-weblogic-operator 1 Thu Aug 29 07:20:02 2019 DEPLOYED weblogic-operator-2
sample-weblogic-operator-ns
traefik-operator 1 Thu Aug 29 07:23:26 2019 DEPLOYED traefik-1.77.1
traefik

Finally, I used the following command (using the EXTERNAL-IP address from the result above), to hit the Traefik’s dashboard:

curl -H 'host: traefik.example.com' http://111.11.11.1

With the following output:

<a href=”/dashboard/”>Found</a>.

Deploying a WebLogic domain

For deploying a WebLogic domain some steps have to be taken.

  • Preparing the Kubernetes cluster to run WebLogic domains

I used the following command, to create the WebLogic domain namespace:

kubectl create namespace sample-domain1-ns

With the following output:

namespace “
sample-domain1-ns” created

I used the following command, to create a Kubernetes secret containing the Administration Server boot credentials:

kubectl -n sample-domain1-ns create secret generic sample-domain1-weblogic-credentials \
>   --from-literal=username=weblogic \
>   --from-literal=password=welcome1

With the following output:

secret “sample-domain1-weblogic-credentials” created

I used the following command, to label the Secret:

kubectl label secret sample-domain1-weblogic-credentials \
>   -n sample-domain1-ns \
>   weblogic.domainUID=sample-domain1 \
>   weblogic.domainName=sample-domain1

The following labels are used:

Label key Label Value
weblogic.domainUID sample-domain1
weblogic.domainName sample-domain1

With the following output:

secret “sample-domain1-weblogic-credentials” labeled

  • Updating Traefik load balancer and Oracle WebLogic Server Kubernetes Operator configuration

Once you have your domain namespace (of the WebLogic domain that is not yet deployed), you have to update the load balancer’s and operator’s configuration about where the domain will be deployed.

I used the following commands, to upgrade the “operator” Helm chart (with the domain namespace, I created earlier):

cd /u01/content/weblogic-kubernetes-operator/
helm upgrade \
>   --reuse-values \
>   --set "domainNamespaces={sample-domain1-ns}" \
>   --wait \
>   sample-weblogic-operator \
>   kubernetes/charts/weblogic-operator

With the following output:

Release “sample-weblogic-operator” has been upgraded. Happy Helming!
LAST DEPLOYED: Thu Aug 29 07:30:08 2019
NAMESPACE:
sample-weblogic-operator-ns
STATUS: DEPLOYED

RESOURCES:
==> v1/Secret
NAME TYPE DATA AGE
weblogic-operator-secrets Opaque 1 10m

==> v1/ConfigMap
NAME DATA AGE
weblogic-operator-cm 3 10m

==> v1/ClusterRoleBinding
NAME AGE
sample-weblogic-operator-ns-weblogic-operator-clusterrolebinding-discovery 10m
sample-weblogic-operator-ns-weblogic-operator-clusterrolebinding-nonresource 10m
sample-weblogic-operator-ns-weblogic-operator-clusterrolebinding-auth-delegator 10m
sample-weblogic-operator-ns-weblogic-operator-clusterrolebinding-general 10m

==> v1/Role
NAME AGE
weblogic-operator-role 10m

==> v1/RoleBinding
NAME AGE
weblogic-operator-rolebinding-namespace 3s
weblogic-operator-rolebinding 10m

==> v1/Service
NAME TYPE CLUSTER-IP EXTERNAL-IP PORT(S) AGE
internal-weblogic-operator-svc ClusterIP 10.96.61.254 8082/TCP 10m

==> v1/ClusterRole
NAME AGE
sample-weblogic-operator-ns-weblogic-operator-clusterrole-namespace 10m
sample-weblogic-operator-ns-weblogic-operator-clusterrole-general 10m
sample-weblogic-operator-ns-weblogic-operator-clusterrole-nonresource 10m
sample-weblogic-operator-ns-weblogic-operator-clusterrole-operator-admin 10m
sample-weblogic-operator-ns-weblogic-operator-clusterrole-domain-admin 10m

==> v1beta1/Deployment
NAME DESIRED CURRENT UP-TO-DATE AVAILABLE AGE
weblogic-operator 1 1 1 1 10m

==> v1/Pod(related)
NAME READY STATUS RESTARTS AGE
weblogic-operator-848cd6c4cb-rpf9v 1/1 Running 0 10m

I used the following commands, to upgrade the Traefik Helm chart (with the domain namespace, I created earlier):

cd /u01/content/weblogic-kubernetes-operator/
helm upgrade \
>   --reuse-values \
>   --set "kubernetes.namespaces={traefik,sample-domain1-ns}" \
>   --wait \
>   traefik-operator \
>   stable/traefik

With the following output:

Release “traefik-operator” has been upgraded. Happy Helming!
LAST DEPLOYED: Thu Aug 29 07:30:30 2019
NAMESPACE:
traefik
STATUS: DEPLOYED

RESOURCES:
==> v1/ConfigMap
NAME DATA AGE
traefik-operator 1 7m
traefik-operator-test 1 7m

==> v1/ClusterRole
NAME AGE
traefik-operator 7m

==> v1/Service
NAME TYPE CLUSTER-IP EXTERNAL-IP PORT(S) AGE
traefik-operator-dashboard ClusterIP 10.96.46.6 80/TCP 7m
traefik-operator LoadBalancer 10.96.253.105 111.11.11.1 80:30542/TCP,443:30638/TCP 7m

==> v1/Deployment
NAME DESIRED CURRENT UP-TO-DATE AVAILABLE AGE
traefik-operator 1 1 1 1 7m

==> v1beta1/Ingress
NAME HOSTS ADDRESS PORTS AGE
traefik-operator-dashboard traefik.example.com 80 7m

==> v1/Pod(related)
NAME READY STATUS RESTARTS AGE
traefik-operator-7f9c8ff8b8-cqxcf 0/1 Terminating 0 7m
traefik-operator-7fdb7f5c99-m6sbq 1/1 Running 0 27s

==> v1/Secret
NAME TYPE DATA AGE
traefik-operator-default-cert Opaque 2 7m

==> v1/ClusterRoleBinding
NAME AGE
traefik-operator 7m

==> v1/ServiceAccount
NAME SECRETS AGE
traefik-operator 1 7m

NOTES:

1. Get Traefik’s load balancer IP/hostname:

NOTE: It may take a few minutes for this to become available.

You can watch the status by running:

$ kubectl get svc traefik-operator –namespace traefik -w

Once ‘EXTERNAL-IP’ is no longer ”:

$ kubectl describe svc traefik-operator –namespace traefik | grep Ingress | awk ‘{print $3}’

2. Configure DNS records corresponding to Kubernetes ingress resources to point to the load balancer IP/hostname found in step 1

  • Deploying a WebLogic domain on Kubernetes

To deploy a WebLogic domain, you need to create a domain resource definition which contains the necessary parameters for the “operator” to start the WebLogic domain properly.

I used the following command, to download the domain resource yaml file and saved it as /u01/domain.yaml:
[https://raw.githubusercontent.com/nagypeter/weblogic-operator-tutorial/master/k8s/domain_short.yaml]

curl -LSs https://raw.githubusercontent.com/nagypeter/weblogic-operator-tutorial/master/k8s/domain_short.yaml >/u01/domain.yaml

The file domain.yaml has the following content:

# Copyright 2017, 2019, Oracle Corporation and/or its affiliates. All rights reserved.

# Licensed under the Universal Permissive License v 1.0 as shown at http://oss.oracle.com/licenses/upl.
#
# This is an example of how to define a Domain resource. Please read through the comments which explain
# what updates are needed.
#
apiVersion: “weblogic.oracle/v2”
kind: Domain
metadata:
# Update this with the `domainUID` of your domain:
name: sample-domain1
# Update this with the namespace your domain will run in:
namespace: sample-domain1-ns
labels:
weblogic.resourceVersion: domain-v2
# Update this with the `domainUID` of your domain:
weblogic.domainUID: sample-domain1

spec:
# This parameter provides the location of the WebLogic Domain Home (from the container’s point of view).
# Note that this might be in the image itself or in a mounted volume or network storage.
domainHome: /u01/oracle/user_projects/domains/sample-domain1

# If the domain home is inside the Docker image, set this to `true`, otherwise set `false`:
domainHomeInImage: true

# Update this with the name of the Docker image that will be used to run your domain:
#image: “YOUR_OCI_REGION_CODE.ocir.io/YOUR_TENANCY_NAME/weblogic-operator-tutorial:latest”
#image: “fra.ocir.io/johnpsmith/weblogic-operator-tutorial:latest”
image: “iad.ocir.io/weblogick8s/weblogic-operator-tutorial-store:1.0”

# imagePullPolicy defaults to “Always” if image version is :latest
imagePullPolicy: “Always”

# If credentials are needed to pull the image, uncomment this section and identify which
# Secret contains the credentials for pulling an image:
#imagePullSecrets:
#- name: ocirsecret

# Identify which Secret contains the WebLogic Admin credentials (note that there is an example of
# how to create that Secret at the end of this file)
webLogicCredentialsSecret:
# Update this with the name of the secret containing your WebLogic server boot credentials:
name: sample-domain1-weblogic-credentials

# If you want to include the server out file into the pod’s stdout, set this to `true`:
includeServerOutInPodLog: true

# If you want to use a mounted volume as the log home, i.e. to persist logs outside the container, then
# uncomment this and set it to `true`:
# logHomeEnabled: false
# The in-pod name of the directory to store the domain, node manager, server logs, and server .out
# files in.
# If not specified or empty, domain log file, server logs, server out, and node manager log files
# will be stored in the default logHome location of /shared/logs//.
# logHome: /shared/logs/domain1

# serverStartPolicy legal values are “NEVER”, “IF_NEEDED”, or “ADMIN_ONLY”
# This determines which WebLogic Servers the Operator will start up when it discovers this Domain
# – “NEVER” will not start any server in the domain
# – “ADMIN_ONLY” will start up only the administration server (no managed servers will be started)
# – “IF_NEEDED” will start all non-clustered servers, including the administration server and clustered servers up to the replica count
serverStartPolicy: “IF_NEEDED”
# restartVersion: “applicationV2”
serverPod:
# an (optional) list of environment variable to be set on the servers
env:
– name: JAVA_OPTIONS
value: “-Dweblogic.StdoutDebugEnabled=false”
– name: USER_MEM_ARGS
value: “-Xms64m -Xmx256m ”
# nodeSelector:
# licensed-for-weblogic: true

# If you are storing your domain on a persistent volume (as opposed to inside the Docker image),
# then uncomment this section and provide the PVC details and mount path here (standard images
# from Oracle assume the mount path is `/shared`):
# volumes:
# – name: weblogic-domain-storage-volume
# persistentVolumeClaim:
# claimName: domain1-weblogic-sample-pvc
# volumeMounts:
# – mountPath: /shared
# name: weblogic-domain-storage-volume

# adminServer is used to configure the desired behavior for starting the administration server.
adminServer:
# serverStartState legal values are “RUNNING” or “ADMIN”
# “RUNNING” means the listed server will be started up to “RUNNING” mode
# “ADMIN” means the listed server will be start up to “ADMIN” mode
serverStartState: “RUNNING”
adminService:
channels:
# Update this to set the NodePort to use for the Admin Server’s default channel (where the
# admin console will be available):
– channelName: default
nodePort: 30701
# Uncomment to export the T3Channel as a service
#- channelName: T3Channel
# serverPod:
# nodeSelector:
# wlservers2: true
# managedServers:
# – serverName: managed-server1
# serverPod:
# nodeSelector:
# wlservers1: true
# – serverName: managed-server2
# serverPod:
# nodeSelector:
# wlservers1: true
# – serverName: managed-server3
# serverPod:
# nodeSelector:
# wlservers2: true
# clusters is used to configure the desired behavior for starting member servers of a cluster.
# If you use this entry, then the rules will be applied to ALL servers that are members of the named clusters.
clusters:
– clusterName: cluster-1
serverStartState: “RUNNING”
replicas: 2
# The number of managed servers to start for any unlisted clusters
# replicas: 1
#
# configOverrides: jdbccm
# configOverrideSecrets: [dbsecret]

I used the following command, to create the Domain:

kubectl apply -f /u01/domain.yaml

With the following output:

domain “sample-domain1” created

I used the following command, to list the Pods:

kubectl get pods -n sample-domain1-ns

With the following output:

NAME READY STATUS RESTARTS AGE
sample-domain1-introspect-domain-job-qkh82 0/1 ContainerCreating 0 28s

Here you see the Pod, being the introspect domain job which needs to be running first.
[https://oracle.github.io/weblogic-kubernetes-operator/userguide/managing-domains/configoverrides/#internal-design-flow]

I used the following command (running it periodically), to list the Pods (with output format wide):

kubectl get pods -n sample-domain1-ns -o wide

After some while, with the following output:

NAME READY STATUS RESTARTS AGE IP NODE
sample-domain1-admin-server 1/1 Running 0 3m 10.244.2.7 10.0.10.2
sample-domain1-managed-server1 1/1 Running 0 3m 10.244.2.8 10.0.10.2
sample-domain1-managed-server2 0/1 ContainerCreating 0 3m 10.0.12.2

And in the end, with the following output:

NAME READY STATUS RESTARTS AGE IP NODE
sample-domain1-admin-server 1/1 Running 0 6m 10.244.2.7 10.0.10.2
sample-domain1-managed-server1 1/1 Running 0 5m 10.244.2.8 10.0.10.2
sample-domain1-managed-server2 1/1 Running 0 5m 10.244.1.4 10.0.12.2

In the end (after I checked periodically), there are three running pods. The whole Domain deployment may take up to 2-3 minutes depending on the compute shapes.

In order to access any application or the Administration Console deployed on WebLogic, you have to configure Traefik Ingress. The load balancer is already assigned during the previous step “Installing and configuring Traefik with a Helm chart”.


NAME TYPE CLUSTER-IP EXTERNAL-IP PORT(S) AGE
traefik-operator
LoadBalancer 10.96.253.105 111.11.11.1 80:30542/TCP,443:30638/TCP 35s

I used the following command, to create the Ingress:

cat << EOF | kubectl apply -f -
> apiVersion: extensions/v1beta1
> kind: Ingress
> metadata:
>   name: traefik-pathrouting-1
>   namespace: sample-domain1-ns
>   annotations:
>     kubernetes.io/ingress.class: traefik
> spec:
>   rules:
>   - host:
>     http:
>       paths:
>       - path: /
>         backend:
>           serviceName: sample-domain1-cluster-cluster-1
>           servicePort: 8001
>       - path: /console
>         backend:
>           serviceName: sample-domain1-admin-server
>           servicePort: 7001          
> EOF

Remark about Ingress:
Ingress exposes HTTP and HTTPS routes from outside the cluster to services within the cluster. Traffic routing is controlled by rules defined on the Ingress resource.
An Ingress can be configured to give Services externally-reachable URLs, load balance traffic, terminate SSL / TLS, and offer name based virtual hosting. An Ingress controller is responsible for fulfilling the Ingress, usually with a load balancer, though it may also configure your edge router or additional frontends to help handle the traffic.
[https://kubernetes.io/docs/concepts/services-networking/ingress/#what-is-ingress]

Remark about Ingress rules:
Each HTTP rule contains the following information:

  • An optional host. If no host is specified, the rule applies to all inbound HTTP traffic through the IP address specified. If a host is provided (for example, foo.bar.com), the rules apply to that host.
  • A list of paths (for example, /testpath), each of which has an associated backend defined with a serviceName and servicePort. Both the host and path must match the content of an incoming request before the load balancer directs traffic to the referenced Service.
  • A backend is a combination of Service and port names as described in the Service doc. HTTP (and HTTPS) requests to the Ingress that matches the host and path of the rule are sent to the listed backend.

A default backend is often configured in an Ingress controller to service any requests that do not match a path in the spec.
[https://kubernetes.io/docs/concepts/services-networking/ingress/#ingress-rules]

Default Backend
An Ingress with no rules sends all traffic to a single default backend. The default backend is typically a configuration option of the Ingress controller and is not specified in your Ingress resources.
If none of the hosts or paths match the HTTP request in the Ingress objects, the traffic is routed to your default backend.
[https://kubernetes.io/docs/concepts/services-networking/ingress/#default-backend]

In the table below we can see, that as a simple solution, path routing is configured, which will route the external traffic through Traefik to the Domain cluster address (to reach a demo web application at the root context path) or the Oracle WebLogic Server Administration Console.

Host Path Backend Route to
Service Port
<no host is specified> / sample-domain1-cluster-cluster-1 8001 A demo web application
<no host is specified> /console sample-domain1-admin-server 7001 Oracle WebLogic Server Administration Console

With the following output:

ingress “traefik-pathrouting-1” created

Once the Ingress has been created, you can construct the URL of the Oracle WebLogic Server Administration Console based on the following pattern:

http://EXTERNAL-IP/console

The EXTERNAL-IP was determined during Traefik install (see above).

Opening the Oracle WebLogic Server Administration Console

I opened a browser and logged in to the Oracle WebLogic Server Administration Console (where I entered the admin user credentials weblogic/welcome1), via URL:

http://111.11.11.1/console

Next, on the left, in the Domain Structure, I clicked on “Environment”.

So, the Domain (named: sample-domain1) has 1 running Administration Server (named: admin-server) and 2 running Managed Servers (named: managed-server1 and managed-server2). The Managed Servers are configured to be part of a WebLogic Server cluster (named: cluster-1). A cluster is a group of WebLogic Server instances that work together to provide scalability and high-availability for applications.

Remark about the use of Oracle WebLogic Server Administration Console:
The use of Oracle WebLogic Server Administration Console is just viewing purposes because the Domain configuration is persisted in the Pod, which means that after a restart the original values (baked into the image) will be used again.

Testing the demo web application

I opened a browser and started the demo web application, via URL:

http://111.11.11.1/opdemo/?dsname=testDatasource

I refreshed the page several times and noticed the hostname changed.

The hostname reflects the Managed Server’s name which responds to the request. So, I saw the load balancing between the two Managed Servers in action.

Opening the Kubernetes Web UI (Dashboard)

Dashboard is a web-based Kubernetes user interface. You can use Dashboard to deploy containerized applications to a Kubernetes cluster, troubleshoot your containerized application, and manage the cluster resources. You can use Dashboard to get an overview of applications running on your cluster, as well as for creating or modifying individual Kubernetes resources (such as Deployments, Jobs, DaemonSets, etc).
[https://kubernetes.io/docs/tasks/access-application-cluster/web-ui-dashboard/]

You can access Dashboard using the kubectl command-line tool by running the following command:

kubectl proxy

Kubectl will make Dashboard available at

http://localhost:8001/api/v1/namespaces/kubernetes-dashboard/services/https:kubernetes-dashboard:/proxy/.

The UI can only be accessed from the machine where the command is executed.
[https://kubernetes.io/docs/tasks/access-application-cluster/web-ui-dashboard/#command-line-proxy]

I used the following command, to access Dashboard:

kubectl proxy

Next, I opened a browser and started Dashboard, via URL:

http://localhost:8001/api/v1/namespaces/kube-system/services/https:kubernetes-dashboard:/proxy/

I selected the Kubeconfig option, clicked on “Choose kubeconfig file”, and selected the kubeconfig file that was created earlier (in my case: /home/oracle/.kube/config). Next, I clicked on button “SIGN IN”.

I clicked on Cluster | Nodes:

Here again you can see that the Kubernetes cluster instance consists of three nodes.

I changed the namespace to sample-domain1-ns and clicked on Workloads | Pods:

Here again you can see that there is one Administration Server and two Managed Servers.

So now it’s time to conclude this article. I described the steps that I went through to get an Oracle WebLogic Domain running on a three-node Kubernetes cluster instance (provisioned by Oracle Container Engine for Kubernetes (OKE)) on Oracle Cloud Infrastructure (OCI) in an existing OCI tenancy.
The Oracle WebLogic Server Kubernetes Operator (which is an application-specific controller that extends Kubernetes) was used because it simplifies the management and operation of WebLogic domains and deployments.

In a next article I will describe how I made several changes to the configuration of the WebLogic domain, for example scaling up the number of managed servers.

The post Deploying an Oracle WebLogic Domain on a Kubernetes cluster using Oracle WebLogic Server Kubernetes Operator appeared first on AMIS Oracle and Java Blog.

Oracle Cloud Always Free Autonomous Data Warehouse – steps to get going

$
0
0

Last month, Oracle announced it’s Cloud Free Tier on Oracle Cloud Infrastructure (OCI). This free tier offers several services (compute, storage, network, monitoring & notifications, serverless functions and Autonomous Database. Two autonomous database instance can be provisioned and leveraged in this “forever free tier” – each with up to 20 GB of data and with [almost?] full functionality. In this article, I will tell you about my first experiences with this free tier and more specifically with the Autonomous Data Warehouse service. The TL;DR: in less than 15 minutes, I had my new Oracle Cloud account with a forever free Autonomous Data Warehouse instance running in it.

The steps are pretty straightforward:

  1. Create your new Oracle Cloud account (Note: I have not been able to add always free instances to my existing Oracle Cloud account)
  2. Create an ‘always free’ instance of the desired services (Note: the $300 one month trial that you get with a new cloud account also enables you to create non-free-tier-eligible instances that will expire after 30 days; take good care!)
  3. Start leveraging your new free instance – not just for 30 days but “forever”

1. Create Oracle Cloud account

To create your new Oracle Cloud account, you can go to https://www.oracle.com/cloud/free/ and click on Start for Free:image

You will be taken to the Sign Up page where you have to provide an email address (that has not been used before to create an Oracle Cloud account) and valid credit card details. This does not mean of course you will be charged for the free tier.

image

Once the account is created, you will receive an email, inviting you to sign in to your account, change your temporary password and then get going.

image


2. Create Instance of Desired Always Free Service

The OCI dashboard that is presented contains a number of quick actions for some of the always free services in the new free tier. I click on Create a data warehouse.

image


First provide the name for the Database and select the type of Autonomous Database service: Data Warehouse or Transaction Processing. image

Next configure the database. And here is something to pay close attention to. Make sure that the switch Always Free is switched on. It took me three tries to get this right (feel free to snigger). Once this setting is on, the CPU core count and the Storage size are automatically set (to one CPU core and 20 GB of data storage). Provide the password for the Admin account. Then click on Create Autonomous Database. And sit back and relax for a little while, as the database instance is provisioned.

image

The next overview is presented while the provisioning takes place:

image

The autonomous databases overview shows my current situation – with the two accidentally created non-free instances that both ate out of the $300 trial account even though I terminated these instances almost as soon as I had created them:

image

After a few minutes, the provisioning is done. I have an AWD instance that is mine for all time to come without paying anything at all. At least that is what Larry stated in his keynote at Oracle OpenWorld 2019.

imageNote: Automatic backups are created daily of the ADW instance; a manual request can be made to restore a backup. 


3. Start leveraging the Always Free Autonomous Data Warehouse instance

Now I can start using the browser based tools for managing and leveraging the database instance – or I can get at the connection details for the database to get going from other instances or desktop tools.

Here the DB Connection tab with [access to] connection details

image

The Performance Hub provides an overview of various performance metrics.

The Service Console opens a new window with several options – Overview:

image

Administration

image

Development

image

From the Development page, several tools can be accessed to work on top of the ADW instance. These include APEX, ORDS and SODA and the Oracle Machine Learning SQL Notebooks (similar to Jupyter Notebooks). Here is the SQL Developer Web interface – also browser based – that allows management of database objects creation of tables, querying of data

image

Similarly – and with some overlap – APEX is available, another web UI for managing users and database objects in the database instance as well as developing low code applications:

image

APEX may also offer the easiest way of quickly loading data into the fresh database instance. Through an APEX Workspace, tables can be created for example by importing a CSV file:

image


Learn how to connect from the SQL* Developer desktop client tool in these two tutorials:


The post Oracle Cloud Always Free Autonomous Data Warehouse – steps to get going appeared first on AMIS Oracle and Java Blog.

Connect local SQL Developer to Oracle Cloud Autonomous Database (Always Free Tier)

$
0
0

In a recent article I described how to provision an instance of Oracle Cloud Autonomous Data Warehouse in the recently launched Always Free Tier of OCI. This article shows how to connect from SQL Developer (desktop tool) to this instance. Note: connecting from SQL Developer is the same [of course] whether the database instance is in the free tier, part of a cloud trial or a regular paid for instance.

If you do not already have a 19.x version of SQL Developer, I suggest you first install that. You can download latest (19.2) version of SQL Developer for free from this location: https://www.oracle.com/tools/downloads/sqldev-v192-downloads.html (you need an Oracle account and you must accept the OTN license agreement)

Install SQL Developer 19.2 – by unzipping to a directory of your choice. Run SQL Developer by running the sqldeveloper.exe file.

image

In your Oracle Cloud Infrastructure dashboard, navigate to your ADW (or ATP) instance. From the DB Connections popup on the ADW Dashboard in OCI, click on Download for the Client Credentials (Wallet) – a zip file:

image

Provide the password for the Admin user:

image

The zip file with client credentials is download.

imageIn SQL Developer, create a new Connection (note: do not create a connection of type Cloud Connection – that type refers to the Schema as an Instance service, not to ATP or Adw):

image

Complete the connection wizard:

SNAGHTML3868b653

  • Provide a name for the connection – you can use spaces and other characters.
  • Set Database Type to Oracle.
  • Provide Username and Password – for example for the admin account that was created when the ATP or ADW instance was provisioned.
  • Select default for role – not SYSDBA or something similar
  • Select Cloud Wallet for connection type (note: this option was not available in SQL Developer 18.2 – the version that I tried to use in my first attempt)
  • In the field Configuration File browse for the zip file with client credentials that was downloaded from the ADW DB Connection popup page.
  • Select one of the options for Service – at this stage it does not matter much which one you select.

Click on button Test to verify your settings. When the result is Success you have succeeded and may proceed.

In the Connections tab, open the newly created connection.

image

You get your first glimpse into the ADW or ATP instance (running in the cloud) from the client side desktop comfort of your own laptop.

You can now make use of all facilities in SQL Developer to import and export data, model database objects, manage objects such as users, jobs, privileges and PL/SQL program units. The location of the database is not really relevant.


The post Connect local SQL Developer to Oracle Cloud Autonomous Database (Always Free Tier) appeared first on AMIS Oracle and Java Blog.


Oracle Data Visualization Desktop Connecting to Oracle Cloud Always Free Autonomous Database

$
0
0

Oracle Cloud now offers the Always Free Tier that comes with an always free Autonomous Data Warehouse (up to 20 GB data storage) as well as an free Autonomous Database for Transaction Processing. In an earlier article, I described how to provision your own Free Autonomous Data Warehouse in Oracle Cloud (in 10 minutes and a little bit). A second article shows how to connect desktop based SQL Developer to the cloud based ADW or ATP instance. In this article, I will show how to connect the desktop tool Oracle Data Visualization for Desktop (the local counterpart to Oracle Analytics Cloud) to the always free Autonomous Data Warehouse instance. (note: connecting to a trial or paid for instance works in exactly the same way).

Oracle Data Visualization for Desktop is a tool you can download from OTN and run locally. It falls under the OTN license, which means that for evaluation and training purposes, you can work with the tool for free.

As a prerequisite, you should download the Client Credentials Wallet for the ADW or ATP instance. You can do so from the OCI Dashboard | Autonomous Database | <Database Instance Dashboard>

image

Click on Download, provide the password for user admin and download the zip-file:

image

Next, run Oracle Data Visualization for Desktop:

image

On the Home Page, click on CreateimageSelect Connection in the popup palet:

image

Next, select Oracle Autonomous Data Warehouse Cloud:

image

The Create Connection dialog appears. Provide the following details:

  • Connection Name
  • Description
  • Host (learn this from the tnsnames.ora file in the client credentials wallet)
  • Port (probably 1522,  learn this from the tnsnames.ora file in the client credentials wallet)
  • Client Credentials – extract the cwallet.sso file from the client credentials wallet and select this file
  • Username – for example admin or some other database user in the ADW instance
  • Password – password for the ADW user
  • Service Name (learn this from the tnsnames.ora file in the client credentials wallet)

image

The contents of the Client Credentials Wallet for the ADW instance and specifically the contents of the tnsnames.ora file (which includes host, port, service name)

SNAGHTML389f9998

Click on Save. The tool will now validate the data provided. Hopefully you will get:

image

After this success indicator, we can start the creation of data sets based on tables in this ADW instance.

For example: click on create and select Data Set:

image

Now select the Connection to the ADW instance:

image

A list of schemas is shown and after selecting the SH schema, we can select the table to base the Data Set on:

image

This means the Data Visualization Desktop tool [in this case running on my laptop] can work with the data in our always free ADW instance on Oracle Cloud Infrastructure. Enough for now. Good luck!


The post Oracle Data Visualization Desktop Connecting to Oracle Cloud Always Free Autonomous Database appeared first on AMIS Oracle and Java Blog.

Loading Data into Always Free Oracle Autonomous Data Warehouse Cloud – from JSON and CSV to Database Table

$
0
0

In a number of recent articles, I have described how to provision an instance of Oracle Data Warehouse Cloud in Oracle Cloud’s Always Free tier. I have also described how to connect both SQL Developer and Data Visualization Desktop to this ADW instance. In this article, we take this one step further and load data into the ADW instance using the Import tool in SQL Developer. Specifically, I start with a JSON file that I load into a Pandas Data Frame in a Jupyter Notebook; that data is saved to a CSV document. This document is imported into SQL Developer and converted into a relational database table. This table and its data can be accessed from SQL Developer Web, SQL Developer, Data Visualization Desktop  and other tools.

The data set in this case is retrieved from the Dutch Central Bureau for Statistics; it concerns a JSON file that contains data on the number of deaths per day, between 1995 and 2017: https://opendata.cbs.nl/statline/#/CBS/nl/dataset/70703ned/table?ts=1566653756419 .

The JSON file is subsequently loaded and manipulated in a Python based Jupyter Notebook, using a Pandas Data frame.

image

The data is finally exported to a simple CSV document with just two fields per record.

image

Now it is time to use SQL Developer:

image

Open the Database Connection to the ADW Instance (that was created in one of my earlier articles); right click on the Tables node and select the option Import Data:

image

The Data Import Wizard has four steps – that are fairly straightforward. Select the file, specify the delimiter and accept the other default values:

image

Step 2- Define the Table Name

image

Step 3 – select the columns:

image

Step 4: refine the column definitions (name):

image

Check the summary and click on Finish:

SNAGHTML397406c2

The import is performed – successfully:

image

The table can be reviewed in SQL Developer:

image

as well as in SQL Developer Web (in the context of the OCI Autonomous Data Warehouse service console):

image

and used as the source for a Data Set in Data Visualization Desktop:

imageimage

This article demonstrated how we can take data in CSV format and turn it into a Database Table in Autonomous Data Warehouse Cloud using SQL Developer Import. A similar feature is available in APEX – also part of the developer toolset in Autonomous Data Warehouse and Autonomous Transaction Processing. CSV files can also be imported into Data Visualization Desktop and via a Data Flow saved to a table in Autonomous Data Warehouse.

Note: two quick summaries created with Data Visualization Desktop:

Death count per year over the years 1995-2017:

image

And a pivot table of the “binned” week day death count sum

image

this pivot table indicates that Sunday is in bin 1 – on the low end of the range – with Friday in the highest bin. Friday turns out to be the day of the week with the highest number of deaths and Sunday the ‘slowest’ day.

And finally this bar chart with the total number of deaths – that confirms the previous finding about the days of the week:

image

The post Loading Data into Always Free Oracle Autonomous Data Warehouse Cloud – from JSON and CSV to Database Table appeared first on AMIS Oracle and Java Blog.

Dissecting Dutch Death Statistics with Python, Pandas and Plotly in a Jupyter Notebook

$
0
0

The CBS (the Dutch Centraal Bureau Statistiek) keeps track of many thing in The Netherlands. And shares many of its data sets as open data, typically in the form of JSON, CSV or XML files. One of the data sets is publishes is the one on the number of births and deaths per day. I have taken this data set, ingested and wrangled the data into a Jupyter Notebook and performed some visualization and analysis. This article describes some of my actions and my findings, including attempts to employ Matrix Profile to find repeating patterns or motifs.

TL;DR : Friday is the day of the week with the most deaths; Sunday is a slow day for the grim reaper in our country. December through March is death season and August and September are the quiet period.

The Jupyter Notebook and data sources discussed in this article can be found in this GitHub Repo: https://github.com/lucasjellema/data-analytic-explorations/tree/master/dutch-birth-and-death-data

Preparation: Ingest and Pre-wrangle the data

Our raw data stems from https://opendata.cbs.nl/statline/#/CBS/nl/dataset/70703ned/table?ts=1566653756419. I have downloaded a JSON file with the deaths per day data. Now I am going to explore this file in my Notebook and wrangle it into a Pandas Data Frame that allows visualization and further analysis.

image

import json
import pandas as pd

ss = pd.read_json("dutch-births-and-deaths-since-1995.json")
ss.head(5)


Data frame ss now contains the contents of the JSON file. The data is yet all that much organized: it consists of individual JSON records that each represent one day – or one month or one year.

I will create additional columns in the data frame – with for each record the date it describes and the actual death count on that date:

image

import datetime
def parse_full_date(row):
dateString = row["Perioden"]
if ('MM' in dateString) or ('JJ' in dateString) or ('X' in dateString):
return None
else:
date = datetime.datetime.strptime(dateString, "%Y%m%d")
return date

def parse_death_count(row):
deathCount = int(row["MannenEnVrouwen_4"])
return deathCount

ss["date"] = ss['value'].apply(parse_full_date)
ss["deathCount"] = ss['value'].apply(parse_death_count)
ss.head(14)


Column date is derived by processing each JSON record and parsing the Perioden property that contains the date (or month or year). The date value is a true Python DateTime instead of a string that looks like a date. The deathCount is taken from the property MannenEnVrouwen_4 in the JSON record.

After this step, the data frame has columns date and deathCount that allows us to start the analysis. We do not need the original JSON content any longer, nor do we care for the records that indicate the entire month or year.

image

# create data frame called data that contains only the data per day
data = ss[ss['date'].notnull()][['date','deathCount']]
data.set_index(data["date"],inplace=True)
data.head(4)

Analysis of Daily Death Count

In this Notebook, I make use of Plotly [Express] for creating charts and visualizations:

image

Let’s look at the evolution of the number of deaths over the years (1995-2017) to see the longer term trends.

image

# initialize libraries
import plotly.graph_objs as go
import plotly.express as px
from chart_studio.plotly import plot, iplot
from plotly.subplots import make_subplots
# sample data by year; calculate average daily deathcount
d= data.resample('Y').mean()['deathCount'].to_frame(name='deathCount')
d["date"]= d.index

# average daily death count per year (and/or total number of deaths per year)
fig = px.line(d, x="date", y="deathCount", render_mode='svg',labels={'grade_smooth':'gradient'}
, title="Average Daily Death Count per Year")
fig.update_layout(yaxis_range=[350,430])
fig.show()

This results in an interactive, zoomable chart with mouse popup – that shows the average number of daily deaths for each year in the period 1995-2017:

imageThe fluctuation is remarkable – 2002 was a far more deadly year than 2008 – and the trend is ominous with the last year (2017) the most deadly of them all.

Conclusion from the overhead plot: there is a substantial fluctuation between years and there seems to be an upward trend (probably correlated with growth of total population – some 60-70 years prior to the years shown here)

The death count data is a timeseries: timestamped records. That means that some powerful operations are at my fingerprints, such as resampling the data with different time granularities. In this case, calculate the yearly sum of deaths and plot those numbers in a bar chart. It will not contain really new information, but it presents the data in different way:

image

# sample data by year; calculate average daily deathcount
d= data.copy().resample('Y').sum()['deathCount'].to_frame(name='deathCount')
d["date"]= d.index

fig = px.bar(d , x="date", y="deathCount"
,title="Total Number of Deaths per Year"
, range_y=[125000,155000]
, barmode="group"
)
fig.show()

And the resulting chart:

image


The next scatter plot shows all number of deaths on day values for a randomly chosen period; the fluctuation from day to day is of course quite substantial. The seasonal fluctuation still shows up.

# arbitrarily show 2013
# ensure axis range from 0-550
fig = px.scatter(data, x="date", y="deathCount", render_mode='svg',labels={'grade_smooth':'gradient'}, title="Death Count per Day")
fig.update_layout(xaxis_range=[datetime.datetime(2013, 1, 1),
datetime.datetime(2013, 12, 31)],yaxis_range=[0,550])
fig.show()

image

image


The next chart shows the daily average number of deaths calculated for each month:

# create a new data frame with the daily average death count calculated for each month; this shows us how the daily average changes month by month
d= data.copy().resample('M').mean()['deathCount'].to_frame(name='deathCount')
d["date"]= d.index
fig = px.scatter(d, x="date", y="deathCount", render_mode='svg',labels={'grade_smooth':'gradient'}
, title="Average Daily Death Count (per month)")
fig.update_layout(xaxis_range=[datetime.datetime(2005, 1, 1),
datetime.datetime(2017, 12, 31)],yaxis_range=[0,550])
fig.show()

image

And the chart:

image


Day of the Week

One question that I am wondering about: is the number of deaths equally distributed over the days of the week. A quick, high level exploration makes clear that there is a substantial difference between the days of the week:

cats = [ 'Monday', 'Tuesday', 'Wednesday', 'Thursday', 'Friday', 'Saturday', 'Sunday']
from pandas.api.types import CategoricalDtype
cat_type = CategoricalDtype(categories=cats, ordered=True)
# create a new data frame with the death counts grouped by day of the week
# reindex is used to order the week days in a logical order (learned from https://stackoverflow.com/questions/47741400/pandas-dataframe-group-and-sort-by-weekday)
df_weekday = data.copy().groupby(data['date'].dt.weekday_name).mean().reindex(cats)
df_weekday

image

In over 20 years of data, the difference between Friday and Sunday is almost 30 – or close to 8%. That is a lot – and has to be meaningful.

A quick bar chart is easily created:

df_weekday['weekday'] = df_weekday.index
# draw barchart
fig = px.bar(df_weekday , x="weekday", y="deathCount"
, range_y=[350,400]
, barmode="group"
)

fig.update_layout(
title=go.layout.Title(
text="Bar Chart with Number of Deaths per Weekday"
))
fig.show()

image

And confirms our finding visually:

image

To make sure we are looking at a consistent picture – we will normalize the data.  What I will do in order to achieve this is calculate an index value for each date – by dividing the death count on that date by the average death count in the seven day period that this date is in the middle of. Dates with a high death count will have an index value of 1.05 or even higher and ‘slow’ days will have an index under 1, perhaps even under 0.95. Regardless of the seasonal and multi year trends in death count, this allows us to compare, aggregate and track the performance of each day of the week.

The code for this [may look a little bit intimidating at first]:

d = data.copy()
d.loc[:,'7dayavg'] = d.loc[:,'deathCount'].rolling(window=7,center=True).mean()
d.loc[:,'relativeWeeklyDayCount'] = d.loc[:,'deathCount']/d.loc[:,'7dayavg']

cats = [ 'Monday', 'Tuesday', 'Wednesday', 'Thursday', 'Friday', 'Saturday', 'Sunday']
from pandas.api.types import CategoricalDtype
cat_type = CategoricalDtype(categories=cats, ordered=True)

# create a new data frame with the death counts grouped by day of the week
# reindex is used to order the week days in a logical order (learned from https://stackoverflow.com/questions/47741400/pandas-dataframe-group-and-sort-by-weekday)
df_weekday = d.copy().groupby(d['date'].dt.weekday_name).mean().reindex(cats)
df_weekday['weekday'] = df_weekday.index

# draw barchart
fig = px.bar(df_weekday , x="weekday", y="relativeWeeklyDayCount"
, range_y=[0.95,1.03]
, barmode="group"
)

fig.update_layout(
title=go.layout.Title(
text="Bar Chart with Relative Number of Deaths per Weekday"
))

fig.show()

image


The 2nd and 3rd line is where the daily death count index is calculated; first the rolling average over 7 days and subsequently the division of the daily death count by the rolling average.

The resulting bar chart confirms our finding regarding days of the week:

image

Over the full period of our data set – more than 20 years worth of data, there is close to 0.08 difference between Friday and Sunday.

I want to inspect next how the index value for each week day has evolved through the 20 years. Was Sunday always the day of the week with the smallest number of deaths? Has Friday consistently been the day with the highest number of deaths?

I have calculated the mean index per weekday over periods of one quarter; for each quarter, I have taken the average index value for each day of the week. And these average index values were subsequently plotted in a line chart.

d = data.copy()
# determine the average daily deathcount over a period of 30 days
d.loc[:,'30dayavg'] = d.loc[:,'deathCount'].rolling(window=30,center=True).mean()
# calculate for each day its ratio vs the rolling average for the period it is in - a value close to 1 - between 0.9 and 1.1
d.loc[:,'relative30DayCount'] = d.loc[:,'deathCount']/d.loc[:,'30dayavg']
# assign to each record the name of the day of the week
d.loc[:,'weekday'] = d['date'].dt.weekday_name
# resample per quarter, (grouping by) for each weekday
grouper = d.groupby([pd.Grouper(freq='1Q'), 'weekday'])
# create a new data frame with for each Quarter the average daily death index for each day of the week (again, between 0.9 and 1.1)
d2 = grouper['relative30DayCount'].mean().to_frame(name = 'mean').reset_index()

d2.head(10)

image

Let’s now show the line chart:

fig = px.line(d2, x="date", y="mean", color="weekday" ,render_mode='svg',labels={'grade_smooth':'gradient'}
, title="Average Daily Death Count Index per Quarter")
fig.show()

image

This chart shows how Sunday has been the day of the week with lowest death count for almost every quarter in our data set. It would seem that Friday is the day with highest number of deaths for most quarters. We see some peaks on Thursday.

The second quarter of 2002 (as well as Q3 2009) shows an especially deep trough for Sunday and a substantial peak for Friday. Q1 2013 shows Friday at its worst.

Note: I am not sure yet what strange phenomenon causes the wild peak for all weekday in Q1 1996. Something is quite off with the data it would seem.

The PlotLy line chart has built in functionality for zooming and filtering selected series from the chart, allowing this clear picture of just Friday, Wednesday and Sunday. The gap between Sunday and Friday is quite consistent. There seems to be a small trend upwards for Friday (in other words: the Friday effect becomes more pronounced) and downwards for Sunday.

image

The Deadly Season – Month of Year

Another question I have: is the number of deaths equally distributed over the months of the year. Spoiler alert: no, it is not. The dead of winter is quite literally that.

The quick inspection: data is grouped by month of the year and the average is calculated for each month (for all days that fall in the same month of the year, regardless of the year)

# create a new data frame with the death counts grouped by month
df_month = data.copy().groupby(data['date'].dt.month).mean()

import calendar
df_month['month'] = df_month.index
df_month['month_name'] = df_month['month'].apply(lambda monthindex:calendar.month_name[monthindex])
# draw barchart
fig = px.bar(df_month , x="month_name", y="deathCount"
, range_y=[320,430]
, barmode="group"
)

fig.update_layout(
title=go.layout.Title(
text="Bar Chart with Number of Average Daily Death Count per Month"
))
fig.show()

image

The bar chart reveals how the death count varies through the months of the year. The range is quite wide – from an average of 352 in August to a yearly high in January of 427. The difference between these months is 75 or more than 20%. It will be clear when the undertakers and funeral homes can best plan their vacation. image

The powerful resample option can be used to very quickly create a data set with mean death count per month for all months in our data set.

# aggregate data per week
m = data.copy().resample('M').mean()
m['monthstart'] = m.index

# draw barchart
fig = px.bar(m , x="monthstart", y="deathCount"
#, range_y=[0,4000]
, barmode="group"
)

fig.update_layout(
title=go.layout.Title(
text="Bar Chart with Daily Average Death Count per Month"
))
fig.show()

image

The resulting chart shows that the average daily death count ranges with the months from a daily average of 510 in chilly January 2017 to only 330 in care free August of 2009. A huge spread!

image


Resources

The Jupyter Notebook and data sources discussed in this article can be found in this GitHub Repo: https://github.com/lucasjellema/data-analytic-explorations/tree/master/dutch-birth-and-death-data

Our raw data stems from https://opendata.cbs.nl/statline/#/CBS/nl/dataset/70703ned/table?ts=1566653756419.

The post Dissecting Dutch Death Statistics with Python, Pandas and Plotly in a Jupyter Notebook appeared first on AMIS Oracle and Java Blog.

Convert Groupby Result on Pandas Data Frame into a Data Frame using …. to_frame()

$
0
0

It is such a small thing. That you can look for in the docs, no Stackoverflow and in many blog articles. After I have used groupby on a Data Frame, instead of getting a Series result, I would like to turn the result into a new Data Frame [to continue my manipulation, querying, visualization etc.]. I feel at home in Data Frames and so do my tools and libraries. It took me a while – and a useful post on StackOverflow – to get things straight.

So here it goes. After my groupby, I use to_frame() to create a new Data Frame based on the result of the groupby operation. I use the parameter name to define the name for the column that holds the result of the aggregation (the mean value in this case)

# resample per quarter, (grouping by) for each weekday
grouper = d.groupby([pd.Grouper(freq='1Q'), 'weekday'])
# create a new data frame with for each Quarter the average daily death index for each day of the week (again, between 0.9 and 1.1) 
d2 = grouper['relative30DayCount'].mean().to_frame(name = 'mean').reset_index()
 

In pictures. First my original data frame:

image

Just applying the groupby with the grouper – in order to aggregate over each Quarter of data grouped by day of the week – gives me a Series object:image

However, by applying to_frame() I get the shiny new Data Frame I was after:

image


The post Convert Groupby Result on Pandas Data Frame into a Data Frame using …. to_frame() appeared first on AMIS Oracle and Java Blog.

Introduction to Oracle Machine Learning – SQL Notebooks on top of Oracle Cloud Always Free Autonomous Data Warehouse

$
0
0

One of the relatively new features available with Oracle Autonomous Data Warehouse is Oracle Machine Learning Notebook. The description on Oracle’s tutorial site states: “An Oracle Machine Learning notebook is a web-based interface for data analysis, data discovery, and data visualization.” If you are familiar with Jupyter Notebooks (often Python based) then you may know and appreciate the Wiki like combination or markdown text and code snippets that are ideal for data lab ‘explorations’ of data sets and machine learning models. I am quite a fan myself. Especially wrangling data, juggling with Pandas Data Frames and visualizing data with Plotly is good fun and it is quite easy to accomplish meaningful and advanced results.

Oracle Database has quite a lot of machine learning inside. Ever since the Darwin Data Mining engine was first added to the Oracle Database – in release 9i R2 back in 2002 – machine learning algorithms have been available on top of data in relational tables from SQL and PL/SQL. The Advanced Analytics database option unleashes that power to organizations today. And in Autonomous Data Warehouse, this option is available, even in the free tier of Oracle Cloud.

Let’s take Oracle ML SQL Notebooks for a quick spin.

From my ADW Dashboard, I go to Service Console:

image

And on Service Console, I go to Oracle ML SQL Notebooks. Note: beforehand, in the Administration tab, I have already created a Oracle ML SQL Notebooks user. Creating that user in the this web based consoled resulted in the creation of a database user in my ADW instance.

image

Logging in with previously created user account:

image

And creating a new notebook:

image

The Notebook executes in the context of the database schema of the currently connected user. the dataman schema was created when the user account was created for Oracle ML SQL Notebooks. I now also create a table in that database schema, using SQL Developer:

image

Now I can work with the data in this table inside the notebook.

Here is our initial view at the empty notebook:

image

The notebook currently contains a single, empty cell. I can add either markdown text (%md), a SQL statement (%sql) or a PL/SQL script (%script) in the cell.

Here are two examples: a rich text cell and a SQL cell:

image

The SQL statement can be more interesting – any valid SQL statement can be used in a cell. Here is a more complex SQL statement, the result of which is visualized in a line chart:

image

The line chart allows me to zoom in on a specific area. It does not allow me to define the format used for the labels displayed on the horizontal axis. I am not sure how I managed to have the the y-axis not show the entire value range (0-481.1). In the next chart – bar chart – I am not able to only show the tip of the bars – to highlight there differences:

image

The meaning by the way of this chart is the difference in average number of deaths between week days. Sunday has far fewer deaths than Friday – but it is not as obvious from the chart as it would be if the y-axis would start at 350 or thereabouts.

By crudely subtracting 350 from each queried value, I get more or less the visual effect I wanted to show:

image

But it is not elegant.

I have tried next to show in a scatter plot (the line chart did not give me a meaningful result for this query) how the number of deaths per weekday evolves throughout the quarters. In the query, I calculate the index of a weekday’s ‘performance’ in a quarter against the average daily death count for that quarter for all weekdays. SQL is versatile – creating the query is fairly straightforward. The scatterplot does a nice job. Still it feels that line chart would have been better.

Note how deadly the Friday turns out to be, quite consistently. The Sunday is the least deadly day, consistently showing up for each quarter as the bottom scoring day of the week.

image

Here is the result I get for the line chart – not at all useful I am afraid:

image

In addition to SQL, we can also use PL/SQL in the cells of the notebook. A simple example:

imageand as a result, the table is created:

image


Using PL/SQL, we can unleash the machine learning capabilities of the ADW – as well as perform many other data preparation and manipulation. Using SQL and the Notebooks visualization features, we can see the results of those operations.

Example Library

The ML SQL Notebooks come with a number of samples. These show off what the notebooks can do – and even more what Machine Learning in the Oracle Database can do. The examples show Regression, Classification, Anomaly Detection and a number of other machine learning models in SQL and PL/SQL.

image

Here a screenshot from the Classification Prediction Model

image


Conclusion

The Oracle ML SQL Notebook is one way of leveraging not just SQL but also PL/SQL and the machine learning models that SQL and PL/SQL can leverage. In this notebook, we can use markdown styled text and SQL statements. The results from executing these statements can be visualized in different ways – bar chart, pie chart, line chart, table, area chart and scatter chart. It is a nice way to do some explorations of your data. However, coming from Jupyter Notebooks and all they have to offer, I can not be too excited about the SQL Notebooks. The features I find lacking most:

  • ability to set (from query results) and use parameters (in queries); there is no ‘session state’ throughout the notebook
  • ability to configure the visualization (for example the value range covered by an axis or the format used to display values)

I assume that the current state of the Oracle ML SQL Notebooks is one that will evolve quickly into a version that is richer in functionality.

Note: a few years back I saw a great demo of a similar mechanism from Oracle Labs; this Data Studio also involved a Notebook style tool, that supported SQL as well as other languages, intermingled in a single notebook. I hope to see some of the functionality shown in Data Studio included in Oracle ML SQL Notebooks:

image

Resources

Original announcement of the Oracle ML SQL Notebooks on Oracle Blogs: https://blogs.oracle.com/machinelearning/introducing-oracle-machine-learning-sql-notebooks-for-the-oracle-autonomous-data-warehouse-cloud

Demo of Oracle Labs Data Studio (JavaOne, 2017) – https://www.youtube.com/watch?v=mWDeEXs_CMQ

image

The post Introduction to Oracle Machine Learning – SQL Notebooks on top of Oracle Cloud Always Free Autonomous Data Warehouse appeared first on AMIS Oracle and Java Blog.

Changing the configuration of an Oracle WebLogic Domain, deployed on a Kubernetes cluster using Oracle WebLogic Server Kubernetes Operator (part 1)

$
0
0

At the Oracle Partner PaaS Summer Camp IX 2019 in Lisbon, held at the end of August, I followed a 5 day during workshop called “Modern Application Development with Oracle Cloud”. In this workshop, on day 4, the topic was “WebLogic on Kubernetes”.
[https://paascommunity.com/2019/09/02/oracle-paas-summer-camp-2019-results-become-a-trained-certified-oracle-cloud-platform-expert/]

At the Summer Camp we used a free Oracle Cloud trial account.

On day 4, I did a hands-on lab in which an Oracle WebLogic Domain was deployed on an Oracle Container Engine for Kubernetes (OKE) cluster using Oracle WebLogic Server Kubernetes Operator.

In a previous article I described the steps that I went through to get an Oracle WebLogic Domain running on a three-node Kubernetes cluster instance (provisioned by Oracle Container Engine for Kubernetes (OKE)) on Oracle Cloud Infrastructure (OCI) in an existing OCI tenancy. The Oracle WebLogic Server Kubernetes Operator (the “operator”), which is an application-specific controller that extends Kubernetes, was used because it simplifies the management and operation of WebLogic domains and deployments.
[https://technology.amis.nl/2019/09/28/deploying-an-oracle-weblogic-domain-on-a-kubernetes-cluster-using-oracle-weblogic-server-kubernetes-operator/]

In this article, I will describe how I made several changes to the configuration of a WebLogic domain:

  • Scaling up the number of managed servers
  • Overriding the WebLogic domain configuration
  • Application lifecycle management (ALM), using a new WebLogic Docker image

In a next article I will describe (among other things) how I made several other changes to the configuration of the WebLogic domain, for example:

  • Assigning WebLogic Pods to particular nodes
  • Assigning WebLogic Pods to a licensed node

In order to get an Oracle WebLogic Domain running on a Kubernetes cluster instance (provisioned by OKE) on Oracle Cloud Infrastructure (OCI) in an existing OCI tenancy, a number of steps had to be taken.

Also, some tools (like kubectl) had to be used. At the Summer Camp our instructors provided us with a VirtualBox appliance for this.

For OKE cluster creation, I used the Quick Create feature, which uses default settings to create a quick cluster with new network resources as required.

Using Oracle WebLogic Server Kubernetes Operator for deploying a WebLogic domain on Kubernetes

In my previous article I described how I used the Oracle WebLogic Server Kubernetes Operator (the “operator”) to simplify the management and operation of WebLogic domains and deployments.
[https://technology.amis.nl/2019/09/28/deploying-an-oracle-weblogic-domain-on-a-kubernetes-cluster-using-oracle-weblogic-server-kubernetes-operator/]

For deploying a WebLogic domain on Kubernetes, I downloaded a domain resource definition which contains the necessary parameters for the “operator” to start the WebLogic domain properly.

I used the following command, to download the domain resource yaml file and saved it as /u01/domain.yaml:
[https://raw.githubusercontent.com/nagypeter/weblogic-operator-tutorial/master/k8s/domain_short.yaml]

curl -LSs https://raw.githubusercontent.com/nagypeter/weblogic-operator-tutorial/master/k8s/domain_short.yaml >/u01/domain.yaml

The file domain.yaml has the following content:

# Copyright 2017, 2019, Oracle Corporation and/or its affiliates. All rights reserved.

# Licensed under the Universal Permissive License v 1.0 as shown at http://oss.oracle.com/licenses/upl.
#
# This is an example of how to define a Domain resource.  Please read through the comments which explain
# what updates are needed.
#
apiVersion: "weblogic.oracle/v2"
kind: Domain
metadata:
  # Update this with the `domainUID` of your domain:
  name: sample-domain1
  # Update this with the namespace your domain will run in:
  namespace: sample-domain1-ns
  labels:
    weblogic.resourceVersion: domain-v2
    # Update this with the `domainUID` of your domain:
    weblogic.domainUID: sample-domain1

spec:
  # This parameter provides the location of the WebLogic Domain Home (from the container's point of view).
  # Note that this might be in the image itself or in a mounted volume or network storage.
  domainHome: /u01/oracle/user_projects/domains/sample-domain1

  # If the domain home is inside the Docker image, set this to `true`, otherwise set `false`:
  domainHomeInImage: true

  # Update this with the name of the Docker image that will be used to run your domain:
  #image: "YOUR_OCI_REGION_CODE.ocir.io/YOUR_TENANCY_NAME/weblogic-operator-tutorial:latest"
  #image: "fra.ocir.io/johnpsmith/weblogic-operator-tutorial:latest"
  image: "iad.ocir.io/weblogick8s/weblogic-operator-tutorial-store:1.0"

  # imagePullPolicy defaults to "Always" if image version is :latest
  imagePullPolicy: "Always"

  # If credentials are needed to pull the image, uncomment this section and identify which
  # Secret contains the credentials for pulling an image:
  #imagePullSecrets:
  #- name: ocirsecret

  # Identify which Secret contains the WebLogic Admin credentials (note that there is an example of
  # how to create that Secret at the end of this file)
  webLogicCredentialsSecret:
    # Update this with the name of the secret containing your WebLogic server boot credentials:
    name: sample-domain1-weblogic-credentials

  # If you want to include the server out file into the pod's stdout, set this to `true`:
  includeServerOutInPodLog: true

  # If you want to use a mounted volume as the log home, i.e. to persist logs outside the container, then
  # uncomment this and set it to `true`:
  # logHomeEnabled: false
  # The in-pod name of the directory to store the domain, node manager, server logs, and server .out
  # files in.
  # If not specified or empty, domain log file, server logs, server out, and node manager log files
  # will be stored in the default logHome location of /shared/logs//.
  # logHome: /shared/logs/domain1

  # serverStartPolicy legal values are "NEVER", "IF_NEEDED", or "ADMIN_ONLY"
  # This determines which WebLogic Servers the Operator will start up when it discovers this Domain
  # - "NEVER" will not start any server in the domain
  # - "ADMIN_ONLY" will start up only the administration server (no managed servers will be started)
  # - "IF_NEEDED" will start all non-clustered servers, including the administration server and clustered servers up to the replica count
  serverStartPolicy: "IF_NEEDED"
#  restartVersion: "applicationV2"
  serverPod:
    # an (optional) list of environment variable to be set on the servers
    env:
    - name: JAVA_OPTIONS
      value: "-Dweblogic.StdoutDebugEnabled=false"
    - name: USER_MEM_ARGS
      value: "-Xms64m -Xmx256m "
#    nodeSelector:
#      licensed-for-weblogic: true

    # If you are storing your domain on a persistent volume (as opposed to inside the Docker image),
    # then uncomment this section and provide the PVC details and mount path here (standard images
    # from Oracle assume the mount path is `/shared`):
    # volumes:
    # - name: weblogic-domain-storage-volume
    #   persistentVolumeClaim:
    #     claimName: domain1-weblogic-sample-pvc
    # volumeMounts:
    # - mountPath: /shared
    #   name: weblogic-domain-storage-volume

  # adminServer is used to configure the desired behavior for starting the administration server.
  adminServer:
    # serverStartState legal values are "RUNNING" or "ADMIN"
    # "RUNNING" means the listed server will be started up to "RUNNING" mode
    # "ADMIN" means the listed server will be start up to "ADMIN" mode
    serverStartState: "RUNNING"
    adminService:
      channels:
       # Update this to set the NodePort to use for the Admin Server's default channel (where the
       # admin console will be available):
       - channelName: default
         nodePort: 30701
       # Uncomment to export the T3Channel as a service
       #- channelName: T3Channel
#    serverPod:
#      nodeSelector:
#        wlservers2: true
#  managedServers:
#  - serverName: managed-server1
#    serverPod:
#      nodeSelector:
#        wlservers1: true
#  - serverName: managed-server2
#    serverPod:
#      nodeSelector:
#        wlservers1: true
#  - serverName: managed-server3
#    serverPod:
#      nodeSelector:
#        wlservers2: true
  # clusters is used to configure the desired behavior for starting member servers of a cluster.
  # If you use this entry, then the rules will be applied to ALL servers that are members of the named clusters.
  clusters:
  - clusterName: cluster-1
    serverStartState: "RUNNING"
    replicas: 2
  # The number of managed servers to start for any unlisted clusters
  # replicas: 1
  #
#  configOverrides: jdbccm
#  configOverrideSecrets: [dbsecret]

I used the following command, to create the Domain:

kubectl apply -f /u01/domain.yaml

With the following output:

domain “sample-domain1” created

Let’s take a closer look at the domain resource yaml file.

Part Value Description
spec | domainHome /u01/oracle/user_projects/domains/sample-domain1 This parameter provides the location of the WebLogic Domain Home (from the container’s point of view).

Note that this might be in the image itself or in a mounted volume or network storage.

spec | domainHomeInImage true If the domain home is inside the Docker image, set this to `true`, otherwise set `false`
spec | image “iad.ocir.io/weblogick8s/weblogic-operator-tutorial-store:1.0” Update this with the name of the Docker image that will be used to run your domain
spec | adminServer
spec | adminServer | serverStartState “RUNNING” serverStartState legal values are “RUNNING” or “ADMIN”

“RUNNING” means the listed server will be started up to “RUNNING” mode

“ADMIN” means the listed server will be start up to “ADMIN” mode

spec | clusters clusters is used to configure the desired behavior for starting member servers of a cluster.

If you use this entry, then the rules will be applied to ALL servers that are members of the named clusters.

spec | clusters | clusterName cluster-1
spec | clusters | serverStartState “RUNNING” serverStartState legal values are “RUNNING” or “ADMIN”

“RUNNING” means the listed server will be started up to “RUNNING” mode

“ADMIN” means the listed server will be start up to “ADMIN” mode

spec | clusters | replicas 2 The number of managed servers to start for any unlisted clusters

Opening the Oracle WebLogic Server Administration Console

As you may remember from my previous article, I opened a browser and logged in to the Oracle WebLogic Server Administration Console and on the left, in the Domain Structure, I clicked on “Environment”.

There you can see that the Domain (named: sample-domain1) has 1 running Administration Server (named: admin-server) and 2 running Managed Servers (named: managed-server1 and managed-server2). The Managed Servers are configured to be part of a WebLogic Server cluster (named: cluster-1).

Scaling a WebLogic cluster

WebLogic Server supports two types of clustering configurations, configured and dynamic. Configured clusters are created by manually configuring each individual Managed Server instance. In dynamic clusters, the Managed Server configurations are generated from a single, shared template. With dynamic clusters, when additional server capacity is needed, new server instances can be added to the cluster without having to manually configure them individually. Also, unlike configured clusters, scaling up of dynamic clusters is not restricted to the set of servers defined in the cluster but can be increased based on runtime demands.

When you create a dynamic cluster, the dynamic servers are preconfigured and automatically generated for you, enabling you to easily scale up the number of server instances in your dynamic cluster when you need additional server capacity. You can simply start the dynamic servers without having to first manually configure and add them to the cluster.

If you need additional server instances on top of the number you originally specified, you can increase the maximum number of server instances (dynamic) in the dynamic cluster configuration or manually add configured server instances to the dynamic cluster.
[https://docs.oracle.com/middleware/1221/wls/CLUST/dynamic_clusters.htm#CLUST705]

The Oracle WebLogic Server Kubernetes provides several ways to initiate scaling of WebLogic clusters, including:

  • On-demand, updating the domain resource directly (using kubectl).
  • Calling the operator’s REST scale API, for example, from curl.
  • Using a WLDF policy rule and script action to call the operator’s REST scale API.
  • Using a Prometheus alert action to call the operator’s REST scale API.

Scaling WebLogic cluster using kubectl
The easiest way to scale a WebLogic cluster in Kubernetes is to simply edit the replicas property within a domain resource. To retain changes, edit the domain.yaml and apply changes using kubectl.

I changed the file domain.yaml, clusters part to the following content:

  clusters:
  - clusterName: cluster-1
    serverStartState: "RUNNING"
    replicas: 3

I used the following command, to apply the changes:

kubectl apply -f /u01/domain.yaml

With the following output:

domain “sample-domain1” created

I used the following command, to list the Pods:

kubectl get pods -n sample-domain1-ns

After a short while, with the following output:

NAME                             READY     STATUS    RESTARTS   AGE
sample-domain1-admin-server      1/1       Running   0          21d
sample-domain1-managed-server1   1/1       Running   1          21d
sample-domain1-managed-server2   1/1       Running   1          21d
sample-domain1-managed-server3   0/1       Running   0          1m

And in the end, with the following output:

NAME                             READY     STATUS    RESTARTS   AGE
sample-domain1-admin-server      1/1       Running   0          21d
sample-domain1-managed-server1   1/1       Running   1          21d
sample-domain1-managed-server2   1/1       Running   1          21d
sample-domain1-managed-server3   1/1       Running   0          4m

In the Oracle WebLogic Server Administration Console, you can see that a third Managed Server is running (named: managed-server3).

Remark:
You can edit directly the existing (running) domain resource file by using the kubectl edit command. In this case your domain.yaml will not reflect the changes of the running domain’s resource.

kubectl edit domain DOMAIN_UID -n DOMAIN_NAMESPACE

In case if you use default settings the syntax is:

kubectl edit domain sample-domain1 -n sample-domain1-ns

It will use a vi like editor.

Remark about using the console:
Do not use the console to scale the cluster. The “operator” controls this operation. Use the operator’s options to scale your cluster deployed on Kubernetes.

Overriding the WebLogic domain configuration

You can modify the WebLogic domain configuration for both the “domain in persistent volume” and the “domain in image” options before deploying a domain resource:

  • When the domain is in a persistent volume, you can use WebLogic Scripting Tool (WLST) or WebLogic Deploy Tooling (WDT) to change the configuration.
  • For either case you can use configuration overrides.

Use configuration overrides (also called situational configuration) to customize a WebLogic domain home configuration without modifying the domain’s actual config.xml or system resource files. For example, you may want to override a JDBC datasource XML module user name, password, and URL so that it references a different database.

You can use overrides to customize domains as they are moved from QA to production, are deployed to different sites, or are even deployed multiple times at the same site.
[https://github.com/oracle/weblogic-kubernetes-operator/blob/2.0/site/config-overrides.md]

Situational configuration consists of XML formatted files that closely resemble the structure of WebLogic config.xml and system resource module XML files. In addition, the attribute fields in these files can embed add, replace, and delete verbs to specify the desired override action for the field.

For more details see the Configuration overrides documentation.

Situational configuration files end with the suffix “situational-config.xml” and are domain configuration files only, which reside in a new optconfig directory. Administrators create, update, and delete situational-config.xml files in the optconfig directory.
[https://docs.oracle.com/middleware/12213/wls/DOMCF/changes.htm#DOMCF-GUID-8EBBC8A0-5CF9-47AB-987D-0B3560CAB8C0]

Preparing the JDBC module override
The “operator” requires a different file name format for override templates than WebLogic’s built-in situational configuration feature. It converts the names to the format required by situational configuration when it moves the templates to the domain home optconfig directory.

The following table describes the format:

Original Configuration Required Override Name
config.xml config.xml
JMS module jms-<MODULENAME>.xml Java Message Service (JMS)
[https://docs.oracle.com/middleware/1221/wls/JMSAD/overview.htm#JMSAD124]
JDBC module jdbc-<MODULENAME>.xml Java Database Connectivity (JDBC)
[https://docs.oracle.com/middleware/12213/wls/JDBCA/jdbc_intro.htm#JDBCA108]
WLDF module wldf-<MODULENAME>.xml WebLogic Diagnostic Framework (WLDF)
[https://docs.oracle.com/middleware/12213/wls/WLDFC/intro.htm#WLDFC107]

A <MODULENAME> must correspond to the MBean name of a system resource defined in your original config.xml file.

So, for JDBC, it has to be jdbc-<MODULENAME>.xml.

The custom WebLogic image I used, has a JDBC Datasource called testDatasource.

So, I had to create a template with the name jdbc-testDatasource.xml. But first I created a directory which will contain only the situational JDBC configuration template and a version.txt file.

I used the following commands, to create the template file jdbc-testDatasource.xml:

mkdir -p /u01/override
cat > /u01/override/jdbc-testDatasource.xml <<'EOF'
<?xml version='1.0' encoding='UTF-8'?>
<jdbc-data-source xmlns="http://xmlns.oracle.com/weblogic/jdbc-data-source"
                  xmlns:f="http://xmlns.oracle.com/weblogic/jdbc-data-source-fragment"
                  xmlns:s="http://xmlns.oracle.com/weblogic/situational-config">
  <name>testDatasource</name>
  <jdbc-driver-params>
    <url f:combine-mode="replace">${secret:dbsecret.url}</url>
    <properties>
       <property>
          <name>user</name>
          <value f:combine-mode="replace">${secret:dbsecret.username}</value>
       </property>
    </properties>
  </jdbc-driver-params>
</jdbc-data-source>
EOF

Remark about the template:
This template contains a macro to override the JDBC user name and URL parameters. The values are referred from a Kubernetes secret.

I used the following command, to create the file version.txt (which reflects the version of the “operator”):

cat > /u01/override/version.txt <<EOF
2.0
EOF

I used the following command, to create a ConfigMap from the directory of template and version file:

kubectl -n sample-domain1-ns create cm jdbccm --from-file /u01/override

With the following output:

configmap “jdbccm” created

I used the following command, to label the ConfigMap:

kubectl -n sample-domain1-ns label cm jdbccm weblogic.domainUID=sample-domain1

The following label is used:

Label key Label Value
weblogic.domainUID sample-domain1

With the following output:

configmap “jdbccm” labeled

I used the following command, to describe the ConfigMap:

kubectl describe cm jdbccm -n sample-domain1-ns

With the following output:

Name:
jdbccm
Namespace:
sample-domain1-ns
Labels: weblogic.domainUID=
sample-domain1
Annotations: <none>

Data
====
version.txt:
—-
2.0


jdbc-testDatasource.xml:
—-
<?xml version=’1.0′ encoding=’UTF-8′?>
<jdbc-data-source xmlns=”http://xmlns.oracle.com/weblogic/jdbc-data-source”
xmlns:f=”http://xmlns.oracle.com/weblogic/jdbc-data-source-fragment”
xmlns:s=”http://xmlns.oracle.com/weblogic/situational-config”>
<name>testDatasource</name>
<jdbc-driver-params>
<url f:combine-mode=”replace”>${secret:
dbsecret.url}</url>
<properties>
<property>
<name>user</name>
<value f:combine-mode=”replace”>${secret:
dbsecret.username}</value>
</property>
</properties>
</jdbc-driver-params>
</jdbc-data-source>


Events: <none>

I used the following command, to create a Secret which contains the values of the JDBC user name and URL parameters:

kubectl -n sample-domain1-ns create secret generic dbsecret --from-literal=username=scott2 --from-literal=url=jdbc:oracle:thin:@test.db.example.com:1521/ORCLCDB

With the following output:

secret “dbsecret” created

I used the following command, to label the Secret:

kubectl -n sample-domain1-ns label secret dbsecret weblogic.domainUID=sample-domain1

The following label is used:

Label key Label Value
weblogic.domainUID sample-domain1

With the following output:

secret “dbsecret” labeled

Before applying these changes, I checked the current JDBC parameters using:

  • the Oracle WebLogic Server Administration Console

  • a demo web application.

I opened a browser and started the demo web application (according to the URL pattern: http://EXTERNAL-IP/opdemo/?dsname=testDatasource), via URL:

http://111.11.11.1/opdemo/?dsname=testDatasource

In the table below you can see the Datasource properties:

Property Value
Datasource name testDatasource
Database User scott
Database URL jdbc:oracle:thin:@//xxx.xxx.x.xxx:1521/ORCLCDB

The final step is to modify the domain resource definition (domain.yaml) to include the override ConfigMap and Secret.

I changed the file domain.yaml, at the end of the spec part to the following content:

spec:
  [ ... ]
  configOverrides: jdbccm
  configOverrideSecrets: [dbsecret]

Restarting the WebLogic domain
Any override change requires stopping all WebLogic pods, applying the domain resource and restarting the WebLogic pods before it can take effect.
To stop all running WebLogic Server pods in the domain, apply a changed resource, and then start the domain.

I changed the file domain.yaml (the property serverStartPolicy) to the following content:

#  serverStartPolicy: "IF_NEEDED"
  serverStartPolicy: "NEVER"

Remark about property serverStartPolicy:
This property determines which WebLogic Servers the Operator will start up when it discovers this Domain. The serverStartPolicy legal values are:

  • “NEVER” will not start any server in the domain
  • “ADMIN_ONLY” will start up only the administration server (no managed servers will be started)
  • “IF_NEEDED” will start all non-clustered servers, including the administration server and clustered servers up to the replica count

I used the following command, to apply the changes, including the one which stops all running WebLogic Server pods in the domain:

kubectl apply -f /u01/domain.yaml

With the following output:

domain “sample-domain1” configured

I used the following command, to list the Pods:

kubectl get pods -n sample-domain1-ns

With, in the end, the following output:

No resources found.

I waited till all pods were terminated and no resources found.

Next, I changed the file domain.yaml (the property serverStartPolicy) to the following content:

  serverStartPolicy: "IF_NEEDED"
#  serverStartPolicy: "NEVER"

I used the following command, to apply the change, which starts WebLogic Server pods in the domain:

kubectl apply -f /u01/domain.yaml

With the following output:
domain “sample-domain1” configured

I used the following command, to list the Pods:

kubectl get pods -n sample-domain1-ns

After some while, with the following output:

NAME                          READY     STATUS    RESTARTS   AGE
sample-domain1-admin-server   0/1       Running   0          11s

And in the end, with the following output:

NAME                             READY     STATUS    RESTARTS   AGE
sample-domain1-admin-server      1/1       Running   0          3m
sample-domain1-managed-server1   1/1       Running   0          1m
sample-domain1-managed-server2   1/1       Running   0          1m
sample-domain1-managed-server3   1/1       Running   0          1m

I checked the new JDBC parameters using the demo web application. I opened a browser and started the demo web application (according to the URL pattern: http://EXTERNAL-IP/opdemo/?dsname=testDatasource), via URL:

http://111.11.11.1/opdemo/?dsname=testDatasource

In the table below you can see the Datasource properties:

Property Value
Datasource name testDatasource
Database User scott2
Database URL jdbc:oracle:thin:@test.db.example.com:1521/ORCLCDB

So here we can see, the expected result from the JDBC module override. The JDBC user name and URL parameters have been changed.

Application Lifecycle Management

As could be seen before, a Docker image (with a WebLogic domain inside) is used to run a domain. This means that all the artefacts including the deployed applications (such as the demo web application mentioned before) and domain related files are stored within the image. This results in a new WebLogic Docker image every time when one or more of the applications is/are modified. In this – widely adopted – approach the image is the packaging unit instead of the Web/Enterprise Application Archive (war, ear).

I changed the file domain.yaml (the property image) to the following content:

#  image: "iad.ocir.io/weblogick8s/weblogic-operator-tutorial-store:1.0"
  image: "iad.ocir.io/weblogick8s/weblogic-operator-tutorial-store:2.0"

Remark about the new image:
The new image contains a domain and an updated version of the demo web application (with a green title on the main page).

I used the following command, to apply the changes:

kubectl apply -f /u01/domain.yaml

With the following output:
domain “sample-domain1” configured

I used the following command, to list the Pods:

kubectl get pods -n sample-domain1-ns

The “operator” now performs a rolling restart of servers, one by one. The first one is the Admin server than the Managed servers.

Rolling restarts is a coordinated and controlled shut down of all of the servers in a domain or cluster while ensuring that service to the end user is not interrupted.
[https://oracle.github.io/weblogic-kubernetes-operator/userguide/managing-domains/domain-lifecycle/restarting/]

After some while, with the following output:

NAME                             READY     STATUS        RESTARTS   AGE
sample-domain1-admin-server      1/1       Running       0          55s
sample-domain1-managed-server1   1/1       Running       0          14m
sample-domain1-managed-server2   1/1       Running       0          14m
sample-domain1-managed-server3   1/1       Terminating   0          14m

And in the end, with the following output:

NAME                             READY     STATUS    RESTARTS   AGE
sample-domain1-admin-server      1/1       Running   0          7m
sample-domain1-managed-server1   1/1       Running   0          1m
sample-domain1-managed-server2   1/1       Running   0          3m
sample-domain1-managed-server3   1/1       Running   0          5m

During the rolling restart of servers, I checked the demo web application periodically.

For this, I opened a browser and started the demo web application (according to the URL pattern: http://EXTERNAL-IP/opdemo/?dsname=testDatasource), via URL:

http://111.11.11.1/opdemo/?dsname=testDatasource

So, here you see that the responding server (sample-domain1-managed-server3) already restarted because you see the change (green fonts) made on the demo web application.

So, here you see the responding server (sample-domain1-managed-server1) is not yet restarted because it still serves the old version of the demo web application.

In the end, the admin server and all three managed servers are restarted.

So now it’s time to conclude this article. In this article I described how I made several changes to the configuration of a WebLogic domain:

  • Scaling up the number of managed servers
  • Overriding the WebLogic domain configuration
  • Application lifecycle management (ALM), using a new WebLogic Docker image

For changing the configuration of a WebLogic domain on Kubernetes, I used a domain resource definition (domain.yaml) which contains the necessary parameters for the “operator” to start the WebLogic domain properly.

In a next article I will describe (among other things) how I made several other changes to the configuration of the WebLogic domain.

The post Changing the configuration of an Oracle WebLogic Domain, deployed on a Kubernetes cluster using Oracle WebLogic Server Kubernetes Operator (part 1) appeared first on AMIS Oracle and Java Blog.

Ordering rows in Pandas Data Frame and Bars in Plotly Bar Chart (by day of the week or any other user defined order)

$
0
0

I have time series data in my Pandas Data Frame. And I want to present an aggregation of the data by day of the way in an orderly fashion – sorted by day of the week. Not alphabetically, but sorted the way humans would order the days – starting from Monday and walking our way to Saturday and Sunday.

After a little searching, I learned how to order data in a Data Frame based on even a random, user defined ordering.The trick is ‘categorical data’ – a limited, and usually fixed, number of possible values that may have a strong (meaningful) order. The lexical order of a categorical variable may not be the same as the logical order (“one”, “two”, “three”). By converting to a categorical and specifying an order on the categories, sorting and min/max will use the logical order instead of the lexical order, see here.

This StackOverflow thread showed me the way.

The starting point is a data frame with time series data – data stamped by date:

image

The data is not sorted in any way.

I want to aggregate: grouping by day of the week, I want to calculate the mean value for deathCount, and I want to present the results order by day of the week – the categorical ordering, not the lexical ordering.

Using the formal categorical type route, I get the result I desire:

from pandas.api.types import CategoricalDtype
cats = [ 'Monday', 'Tuesday', 'Wednesday', 'Thursday', 'Friday', 'Saturday', 'Sunday']
cat_type = CategoricalDtype(categories=cats, ordered=True)
data['Day of Week'] = data['date'].dt.weekday_name
data['Day of Week']=data['Day of Week'].astype(cat_type)
df_weekday = data.groupby(d['Day of Week']).mean()
df_weekday

image

I define the CategoricalDtype called cat_type and explicitly set the type of the Day of Week column to this categorical type. This defines the ordering of this column.

By changing the order of the weekday names in the cats list, I can define different ordering. It is mine to govern!

In this case, a simpler – less formal, less clear perhaps – option is available through the reindex operation that I can perform on a Data Frame:

cats = [ 'Monday', 'Tuesday', 'Wednesday', 'Thursday', 'Friday', 'Saturday', 'Sunday']
# create a new data frame with the death counts grouped by day of the week 
# reindex is used to order the week days in a logical order (learned from https://stackoverflow.com/questions/47741400/pandas-dataframe-group-and-sort-by-weekday)
df_weekday = data.copy().groupby(data['date'].dt.weekday_name).mean().reindex(cats)
df_weekday

image

The effect is the same – by reindexing the data frame using the cats list, I order the data frame’s rows in the order prescribed by the list.

After ensuring the rows in data frame df_weekday are in a meaningful order, I can plot the bar chart with the bars in a meaningful order:

image


Resources

Pandas Documentation on Categorical Data: https://pandas.pydata.org/pandas-docs/stable/user_guide/categorical.html

Pandas Doc on reindex: https://pandas.pydata.org/pandas-docs/stable/reference/api/pandas.DataFrame.reindex.html

The post Ordering rows in Pandas Data Frame and Bars in Plotly Bar Chart (by day of the week or any other user defined order) appeared first on AMIS Oracle and Java Blog.


PostgreSQL EDB College Tour

$
0
0

Welke dingen zijn van cruciaal belang voor een eenvoudige, foutloze installatie en implementatie van Postgres SQL? Wil je meer weten over het draaien van de database in containers en de cloud? Of ben je benieuwd naar dé killer features?

PostgreSQL is al geruime tijd een hele goede optie voor relationele databases. Zeker de laatste tijd zien we een sterke piek in populariteit.

Graag helpen we jou om de inzet van Postgres tot een écht succes te maken.

Kom daarom op 18 november naar Conclusion Utrecht voor een Q&A met Bruce Momjian! Tussen 14:00 en 17:00 beantwoordt hij al je prangende vragen.

De meest inspirerende vraag? Die wint een toffe prijs.

Kom je ook?
Meld je nu aan via deze link!

The post PostgreSQL EDB College Tour appeared first on AMIS Oracle and Java Blog.

Getting started with Windows Subsystem for Linux, Ubuntu and Docker

$
0
0

Starting with a vanilla Windows 10 environment, it took just a few simple steps to get going with Linux on my Windows machine in the Windows Subsystem for Linux (WSL). Note: this is not yet Version 2 of wsl which is currently in (limited) preview

  • install Ubuntu App from Windows App Store
  • enable Windows Linux Subsystem feature
  • run Ubuntu (in elevated mode – as Windows Admin)
    • create Linux user
    • update Ubuntu (optional)
  • do your Linux things
    • understand interaction between Linux and Windows file system
  • as an example: install and run Apache server (and access from web browser on Windows)

1. Download Ubuntu (or any other Linux distro) App from Windows App Store

image

2. Enable Windows Linux Subsystem feature

image

image

3. run Ubuntu (in elevated mode – as Windows Admin)

image

You are prompted to create a Linux user.

Update Ubuntu (optional)

sudo apt upgrade


4.do your Linux things

I did the somewhat confusing act of creating a user called linux – hence the weird home directory

image

and yes, I used vi to edit file myfile.txt!

5. understand interaction between Linux and Windows file system

    The Linux file system is mapped to the Windows file system - in the following way (as I learned from this thread)

    C:\Users\<Windows Username>\AppData\Local\Packages\CanonicalGroupLimited.UbuntuonWindows_79rhkp1fndgsc\LocalState\rootfs\home\<Linux Username>

    6. Install Apache

    (see: https://www.how2shout.com/how-to/install-apache-on-windows-10-wsl-http-server.html)

    SNAGHTML122edfb4

    Start the Apache HTTPD service

    sudo service apache2 start

    In my case, the popup for Windows Defender Firewall appeared and the initial startup of Apache failed.

    image


    By pressing Allow Access and trying again, I got Apache to start:image

    Access the Apache web server from the Windows Browser (outside WSL – at http://127.0.0.1):

    SNAGHTML123132db

    Note on Docker:

    I have tried to get Docker running no WSL. However, the most recent version of Docker Community Edition that has been verified to run on Windows Subsystem Linux is 17.09.0 (see: https://medium.com/faun/docker-running-seamlessly-in-windows-subsystem-linux-6ef8412377aa) and I could not easily find that version of Docker CE – though I did not try very hard.

    Note 2: WSL is quite neatly separated from my regular Windows environment and in that sense is similar to a container or a VM. However, I can not run applications from or as a Docker Container – which is a bit of a shame.

    image

    The post Getting started with Windows Subsystem for Linux, Ubuntu and Docker appeared first on AMIS Oracle and Java Blog.

    Calling out from Java to JavaScript (with call back) – leveraging interoperability support of GraalVM

    $
    0
    0

    imageInteroperability from Java to JavaScript has been an objective for the Java community for quite a while. With Rhino and later Nashorn, two valiant attempts were made to add scripting interaction to the JDK and JVM. Now, with GraalVM, there is a better alternative for running JavaScript code from within Java applications. The interaction itself is faster, more robust and more ‘native’ (rather than bolt-on). For developers, the interaction is easier to implement. And as a bonus: the interaction that GraalVM allows from Java to JavaScript is also available for any other language that the GraalVM runtime can handle – including R, Ruby, Python and LLVM (C, C++, Rust, Swift and others).

    By picking GraalVM 1.0 (based on JDK 8) as the runtime environment you enable the interoperability from Java to any of the languages GraalVM can run. No additional setup is required to interact with JavaScript; if you want to call out to Python, you first need to install graalpython.

    On November 19th 2019 we will see the release of GraalVM 19.3 with support for Java 11. Note: GraalVM can be injected into your Java VM as the JIT Compiler of choice, bringing performance enhancements to most modern Java applications.

    In this article, I will discuss a number of intricacies encountered when making Java code talk to JavaScript code. In slightly increasing levels of complexity, I will show:

    • Evaluate JavaScript code snippets
    • Load JavaScript sources from separate files and invoke functions defined in them
    • Exchange data and objects back and forth between Java and JavaScript
    • Allow JavaScript code called from Java to callback to Java objects
    • Run multiple JavaScript threads in parallel

    In a follow up article I will go through the steps of making the functionality of a rich NPM module available in my Java application. And after that, I will discuss the route in the other direction in a further article: calling Java from a Node(NodeJS) or JavaScript application.

    I will assume that the GraalVM (19.2.1 – release in October 2019) runtime environment has been set up, and take it from there. Sources for this article are in GitHub: https://github.com/AMIS-Services/jfall2019-graalvm/tree/master/polyglot/java2js 

    1. Evaluate JavaScript code snippets

    The Graal package org.graalvm.polyglot contains most of what we need for the interaction from Java to other languages. Using the Context class from that package, we have to setup a Polyglot Context in our code. We can then use this context to evaluate any snippet of code – in this case a snippet of js (meaning JavaScript or ECMA Script). The print command in this snippet is executed as System.out.println – printing the string to the system output.

    When the snippet evaluation results in an object – for example a function as in line 10 of the sample – then this object is returned to Java as a Polyglot Value. Depending on the type of the Value, we can do different things with it. In this case, because the JavaScript code resolved to function, the Polyglot Value in variable helloWorldFunction can be executed, as is done in line 13. The input parameters to te executable object are passed as parameters to the execute method on the Value and the result from the execution is once again a Polyglot Value. In this case, the type of the Value is String and we can easily cast it to a Java String.

    image

    2. Load JavaScript sources from separate files and invoke functions defined in them

    Instead of polluting our Java sources with inline JavaScript (bad practice in my view), we can load JavaScript sources from stand alone files and have them evaluated. Subsequently, we can access the data objects and functions defined in those files from Java code.

    Again, a Polyglot Context is created. Next, a File object is defined for the JavaScript source file (located in the root directory of the Java application). The eval method on the context is executed on the File object, to load and evaluate the source code snippet. This will add the two functions fibonacci and squareRoot to the bindings object in the Polyglot Context. This object has entries for the objects that are evaluated from inline snippets and evaluated source files alike. Note that we can evaluate more File objects – to load JavaScript functions and data objects from multiple files.

    Next we can retrieve the function object from the bindings object in the context and execute it.

    image

    3. Exchange data and objects back and forth between Java and JavaScript

    Between the worlds of Java and JavaScript, there is a polyglot middle ground, an interface layer that can be accessed from both sides of the language fence. Here we find the bindings object – in a bilateral interaction. This bindings object may be used to read, modify, insert and delete members in the top-most scope of the language. We have seen the bindings object already as the map that stores all functions that result from evaluating JavaScript sources loaded into our Polyglot context in Java.

    (Note: In addition, there is a polyglot bindings objects that may be used to exchange symbols between the host and multiple guest languages. All languages have unrestricted access to the polyglot bindings. Guest languages may put and get members through language specific APIs)

    image

    There are several different situations we could take a look at. For example: when a snippet of JavaScript is evaluated, any function or object it defines is added to the Bindings object and is therefore accessible from Java. A simple example of this is shown here, where the JavaScript snippet defines a constant PI, that subsequently becomes accessible from Java:

    image

    and the output from the Java program:

    image

    Here is an example of Java preparing a Java Map and putting this Map in Bindings in a way (as ProxyObject) that makes it accessible as ‘regular’ JavaScript object to JavaScript code. The JavaScript code reads values from the Map and also adds a value of its own. It could also have changed or removed entries in or from the Map. The Map is effectively open to read/write access from both worlds – Java and JavaScript:

    image

    image

    And the system output:

    image 

    The next example has a file with data in JSON format that is loaded as JavaScript resource. The data is subsequently accessed from Java.

    image

    The way we have to deal with arrays across language boundaries is not super smooth. It can be done – and perhaps in a better way than I have managed to uncover. Here is my approach – where the JavaScript file is loaded and evaluated, resulting in the countries object – a JavaScript array of objects – being added to the bindings object. When retrieved in Java from the bindings object, we can check for ArrayElements on the Polyglot Value object and iterate through the ArrayElements. Each element – a JavaScript object – can be cast to a Java Map and the properties can be read:

    image

    The output:

    image

    Note: here is what the file looks like. It is not plain JSON – it is JavaScript that defines a variable countries using data specified in JSON format – and copy/pasted from an internet resource:

    image

    4. Allow JavaScript code called from Java to call back to Java objects

    If we place Java Objects in Bindings – then methods on these objects can be invoked from JavaScript. That is: if we have specified on the Class that methods are ‘host accessible’. A simple example of this scenario is shown here:

    imageOur Java application has created an object from Class FriendlyNeighbour, and added this object to Bindings under the key friend. Subsequently, when a JavaScript snippet is executed from Java, this snippet can get access to the friend object in the Bindings map and invoke a method on this object.

    The code for the Java Application is shown here:

    image

    The class FriendlyNeighbour is quite simple – except for the @HostAccess annotation that is required to make a method accessible from the embedding language.

    image

    The output we get on the console should not surprise you:

    image

    This demonstrates that the JavaScript code invoked from Java has called back to the world of Java – specifically to a method in an object that was instantiated by the Java Object calling out to JavaScript. This object lives on the same thread and is mutually accessible. The result from calling the Java object from JS is printed to the output and could of course also have been returned to Java.

    5. Run multiple JavaScript threads in parallel

    Multiple JavaScript contexts can be initiated from the Java application. These can be associated with parallel running Java threads. Indirectly, these JavaScript contexts can run in parallel as well. However, they cannot access the same Java object without proper synchronization in Java.

    In this example, the Java Object cac (based on class CacheAndCounter) is created and added to bindings object in two different JavaScript Context objects. It is the same object – accessible from two JS realms. The two JavaScript contexts can each execute JS code in parallel with each other. However, when the two worlds collide – because they want to access the same Java Object (such as cac) – then they have to use synchronization in the Java code to prevent race conditions from being possible.

    image

    Here is a somewhat complex code snippet that contains the creation of two threads that both create a JavaScript context using the same JavaScript code (not resulting the same JavaScript object) and both accessing the same Java object – object cac that is instantiated and added to the Binding maps in both JavaScript contexts. This allows the JavaScript “threads” to even mutually interact – but this interaction has to be governed by synchronization on the Java end.

    image

    The output shows that the two threads run in parallel.  They both have a random sleep in their code. Sometimes, the main thread gets in several subsequent accesses of cac and at other times the second thread will get in a few rounds. They both access the same object cac from their respective JavaScript contexts – even these contexts are separate. We could even have one JavaScript context interact with the second JavaScript context – which is running through a different thread Java thread – through the shared object. image

    For completeness sake, the salient code from the CacheAndCounter class:

    image


    Resources

    GitHub Repository with sources for this article: https://github.com/AMIS-Services/jfall2019-graalvm/tree/master/polyglot/java2js 

    Why the Java community should embrace GraalVM – https://hackernoon.com/why-the-java-community-should-embrace-graalvm-abd3ea9121b5

    Multi-threaded Java ←→JavaScript language interoperability in GraalVM  https://medium.com/graalvm/multi-threaded-java-javascript-language-interoperability-in-graalvm-2f19c1f9c37b

    #WHATIS?: GraalVM – RieckPIL – https://rieckpil.de/whatis-graalvm/

    GraalVM: the holy graal of polyglot JVM? – https://www.transposit.com/blog/2019.01.02-graalvm-holy/

    JavaDocs for GraalVM Polyglot – https://www.graalvm.org/truffle/javadoc/org/graalvm/polyglot/package-summary.html

    GraalVM Docs – Polyglot – https://www.graalvm.org/docs/reference-manual/polyglot/ 

    Mixing NodeJS and OpenJDK – Language interop and vertical architecture -Mike Hearn – https://blog.plan99.net/vertical-architecture-734495f129c4

    Enhance your Java Spring application with R data science Oleg Šelajev – https://medium.com/graalvm/enhance-your-java-spring-application-with-r-data-science-b669a8c28bea

    GraalVM Archives on Medium – https://medium.com/graalvm/archive

    GraalVM GitHub Repo – https://github.com/oracle/graal

    GraalVM Project WebSite – https://www.graalvm.org/

    The post Calling out from Java to JavaScript (with call back) – leveraging interoperability support of GraalVM appeared first on AMIS Oracle and Java Blog.

    Leverage NPM JavaScript Module from Java application using GraalVM

    $
    0
    0

    imageInteroperability from Java to JavaScript has been an objective for the Java community for quite a while. With GraalVM, there is great way to run JavaScript code from within Java applications. The interaction itself is faster, more robust and more ‘native’ (rather than bolt-on) than earlier mechanisms. For developers, the interaction is easy to implement. And this opens up great opportunities for leveraging from Java many of the great community resources in the JavaScript community – for example many of the modules available from NPM.

    This article shows how the NPM Validator Module – which implements dozens of very useful data validation algorithms – can be hooked into a Java application. With little effort, the Java developer tasked with implementing and endlessly testing several advanced validations is able to make use of what his JavaScript brothers and sisters have produced and shared. Of course the Validator module is just an example – thousands of NPM modules can be woven into Java applications through the polyglot capabilities of GraalVM.

    Note: what we can do from Java to JavaScript can also be done to any other language that the GraalVM runtime can handle – including R, Ruby, Python and LLVM (C, C++, Rust, Swift and others). So our Java application can benefit from more than just the JavaScript community. And vice versa: any language that can run on GraalVM can call out to any other language. So the mutual benefit is not restricted to Java making use of other language resources – it works in all directions.

    By picking GraalVM 19.2.1 (based on JDK 8) as the runtime environment you enable the interoperability from Java to any of the languages GraalVM can run. No additional setup is required to interact with JavaScript. On November 19th 2019 we will see the release of GraalVM 19.3 with support for Java 11.

    In an earlier article, I have given an introduction to the interoperability from Java to JavaScript. I will now build on that article as my foundation, so I will assume the reader knows about GraalVM polyglot, how to evaluate JavaScript code snippets in Java, how to load JavaScript sources from separate files and invoke functions defined in them and how to exchange data and objects back and forth between Java and JavaScript. With that knowledge in place, what we are about to do in this article is a piece of cake or a cup of peanuts.

    Sources for this article are in GitHub: https://github.com/AMIS-Services/jfall2019-graalvm/tree/master/polyglot/java2js

    The Challenge

    I am developing a Java application. I need to perform validations on input data: Postal Code (various countries), Mobile Phone Numbers (many countries), Email Address, Credit Card Number etc.

    In simplified pseudo code:

    imageimage

    I need to implement (or get my hands on) the postalCode Validator – for starters.

    The NPM Module Validator offers most of these OOTB (Out of the Box)

    image

    image

    But… it is written in JavaScriptimage

    How could that possibly help me?

    GraalVM to the rescue.

    The Solution

    Spoiler alert: here comes the end result. This is the final code, after integrating NPM Module Validator into my Java application:

    image

    The major changes are: I retrieve an implementation for the postalCodeValidator from somewhere and I can invoke it. I have not written any code to do the validation of postal codes in 27 different countries. And there is this new package called org.graalvm.polyglot that I import and from which I use classes Context and Value. And finally, there is a resource called validator_bundled.js loaded from file. That resource happens to be the Web Packed bundle created create from all JavaScript resources in NPM module Validator. It is that simple.

    Running this code gives me:

    image

    Implementation Steps

    The most important thing I had to figure out was: how to make GraalJS – the JavaScript implementation on GraalVM – work with the module structure in the NPM Validator module. GraalJS does not support require() or CommonJS. In order to make it work with NPM modules – they have to be turned into ‘flat’ JavaScript resources – self-contained JavaScript source file. This can be done using one of the many popular open-source bundling tools such as Parcel, Browserify and Webpack. Note: ECMAScript modules can be loaded in a Context simply by evaluating the module sources. Currently, GraalVM JavaScript loads ECMAScript modules based on their file extension. Therefore, any ECMAScript module must have file name extension .mjs.

    The steps to turn an NPM module into a self contained bundle dat GraalVM can process are these:

    • check GraalVM compatibility of NPM module
    • install npx (executable runner – complement to npm which is not included with GraalVM platform)
    • install webpack and webpack-cli
    • install validator module with npm
    • produce self contained bundle for validator module with webpack

    When this is done, loading and using validator in Java is the same as with any other JavaScript source – as we will see.

    1. Check GraalVM compatibility of NPM module with the GraalVM compatibility check:

    image

    2. install npx – executable runner – complement to npm which is not included with GraalVM platform

    image

    3. install webpack and webpack-cli

    image

    4. install validator module with npm

    image

    5. produce self contained bundle for validator module with webpack

    image

    image

    #install npx
    npm install -g npx 
    
    #install webpack
    npm install webpack webpack-cli
    
    #install validator module
    npm install validator
    
    #create single bundle for valudator module
    /usr/lib/jvm/graalvm-ce-19.2.1/jre/languages/js/bin/npx  webpack-cli --entry=./node_modules/validator/index.js --output=./validator_bundled.js --output-library-target=this --mode=development
    
    #Argument: output-library-target, Choices are : "var", "assign", "this", "window", "self", "global", "commonjs", "commonjs2", "commonjs-module", "amd", "umd", "umd2", "jsonp"
    

    Call Validator Module from Java application

    With the Validator module turned into a single self-contained file without non-supported module constructs, we can load this resource into a GraalVM Polyglot context in our Java application running on the GraalVM runtime engine, and invoke any top level function in that context. In order to validate postal codes in Java – here is a very simple code snippet that does just that. Note: the validator_bundled.js is located in the root of our classpath.

    image

    package nl.amis.java2js;
    
    import java.io.File;
    import java.io.IOException;
    import org.graalvm.polyglot.*;
    
    public class ValidateThroughNPMValidator {
    
    	private Context c;
    
    	public ValidateThroughNPMValidator() {
    		// create Polyglot Context for JavaScript and load NPM module validator (bundled as self contained resource)
    		c = Context.create("js");
    		try {
    			// load output from WebPack for Validator Module - a single bundled JS file
    			File validatorBundleJS = new File(
    					getClass().getClassLoader().getResource("validator_bundled.js").getFile());
    			c.eval(Source.newBuilder("js", validatorBundleJS).build());
    			System.out.println("All functions available from Java (as loaded into Bindings) "
    					+ c.getBindings("js").getMemberKeys());
    		} catch (IOException e) {
    			e.printStackTrace();
    		}
    	}
    
    	public Boolean isPostalCode(String postalCodeToValidate, String country) {
    		// use validation function isPostalCode(str, locale) from NPM Validator Module to validate postal code
    		Value postalCodeValidator = c.getBindings("js").getMember("isPostalCode");
    		Boolean postalCodeValidationResult = postalCodeValidator.execute(postalCodeToValidate, country).asBoolean();
    		return postalCodeValidationResult;
    	}
    
    	public static void main(String[] args) {
    		ValidateThroughNPMValidator v = new ValidateThroughNPMValidator();
    		System.out.println("Postal Code Validation Result " + v.isPostalCode("3214 TT", "NL"));
    		System.out.println("Postal Code Validation Result " + v.isPostalCode("XX 27165", "NL"));
    	}
    
    }


    The resulting output:

    image

    Resources

    GitHub Repository with sources for this article: https://github.com/AMIS-Services/jfall2019-graalvm/tree/master/polyglot/java2js

    NPM Module Validator

    GitHub for GraalJS – https://github.com/graalvm/graaljs

    Bringing Modern Programming Languages to the Oracle Database with GraalVM

    Presentation at HolyJS 2019 (St Petersburg, Russia): Node.js: Just as fast, higher, stronger with GraalVM

    Docs on GraalJS and Interoperability with Java – https://github.com/graalvm/graaljs/blob/master/docs/user/NodeJSVSJavaScriptContext.md

    Why the Java community should embrace GraalVM – https://hackernoon.com/why-the-java-community-should-embrace-graalvm-abd3ea9121b5

    Multi-threaded Java ←→JavaScript language interoperability in GraalVM  https://medium.com/graalvm/multi-threaded-java-javascript-language-interoperability-in-graalvm-2f19c1f9c37b

    #WHATIS?: GraalVM – RieckPIL – https://rieckpil.de/whatis-graalvm/

    GraalVM: the holy graal of polyglot JVM? – https://www.transposit.com/blog/2019.01.02-graalvm-holy/

    JavaDocs for GraalVM Polyglot – https://www.graalvm.org/truffle/javadoc/org/graalvm/polyglot/package-summary.html

    GraalVM Docs – Polyglot – https://www.graalvm.org/docs/reference-manual/polyglot/

    Mixing NodeJS and OpenJDK – Language interop and vertical architecture -Mike Hearn – https://blog.plan99.net/vertical-architecture-734495f129c4

    Enhance your Java Spring application with R data science Oleg Šelajev – https://medium.com/graalvm/enhance-your-java-spring-application-with-r-data-science-b669a8c28bea

    Awesome GraalVM: Create a Java API on top of a JavaScript library

    GraalVM Archives on Medium – https://medium.com/graalvm/archive

    GraalVM GitHub Repo – https://github.com/oracle/graal

    GraalVM Project WebSite – https://www.graalvm.org/

    The post Leverage NPM JavaScript Module from Java application using GraalVM appeared first on AMIS Oracle and Java Blog.

    Oracle Database: Write arbitrary log messages to the syslog from PL/SQL

    $
    0
    0

    Syslog is a standard for message logging, often employed in *NIX environments. It allows separation of the software that generates messages, the system that stores them, and the software that reports and analyzes them. Each message is labeled with a facility code, indicating the software type generating the message, and assigned a severity level.

    In *NIX systems syslog messages often end up in /var/log/messages. You can configure these messages to be forwarded to remote syslog daemons. Also a pattern which often seen is that the local log files are monitored and processed by an agent.

    Oracle database audit information can be send to the syslog daemon. See for example the audit functionality. If you however want to use a custom format in the syslog or write an entry to the syslog which is not related to an audit action, this functionality will not suffice. How to achieve this without depending on the audit functionality is described in this blog post. PL/SQL calls database hosted Java code. This code executes an UDP call to the local syslog. You can find the code here.

    Syslog functionality

    There are different ways to send data to the syslog.

    • By using the logger command
    • Using TCP
    • Using UDP

    You can execute shell commands from the Oracle database by wrapping them in Java or C or by using DBMS_PIPE (see here). When building a command-line however to log an arbitrary message, there is the danger that the message will contain characters which might break your logger command or worse, do dangerous things on your OS as the user running your database. You can first write a file to a local directory from the database and send that using the logger command, but this is a roundabout way. Using UDP and TCP is more secure and probably also performs better (although I haven’t tested this).

    TCP in contrast to UDP works with an acknowledgement of a message. This is done in order to provide the sender some confirmation the packet has been received. With UDP, it is ‘fire-and-forget’ for the sender and you do not know if the receiver has received the packet. UDP is faster as you can imagine since no confirmation is send. 

    In this example I will be using UDP to send a message to the local syslog. In order to allow this, rsyslog needs to be installed. 

    For Fedora this can be done with:

    dnf install rsyslog
    

    Next configure UDP access by uncommenting the below two lines in /etc/rsyslog.conf

    $ModLoad imudp
    $UDPServerRun 514
    

    If the daemon is not running, start it with:

    systemctl start rsyslog
    

    If you want to start it on boot, do:

    systemctl enable rsyslog
    

    You might have to configure your firewall to allow access from localhost/127.0.0.1 to localhost/127.0.0.1 UDP port 514

    Java in the Oracle Database

    The Oracle database has out of the box packages to do TCP (DBMS_TCP). However there is no such functionality for UDP available. In order to provide this, I’ve written a small Java class. It can be installed using just PL/SQL code. I’ve tried this on Oracle DB 19c (using the following Vagrant box) but it is likely to work on older versions.

    Create a testuser

    First create a testuser and grant it the required permissions:

    create user testuser identified by Welcome01;
    /
    grant connect,dba,resource to testuser;
    /
    begin
    dbms_java.grant_permission( 'TESTUSER', 'SYS:java.net.SocketPermission', 'localhost:0', 'listen,resolve' );
    dbms_java.grant_permission( 'TESTUSER', 'SYS:java.net.SocketPermission', '127.0.0.1:514', 'connect,resolve' );
    end;
    /
    

    Register the Java code

    Now create the Java code under the user TESTUSER. The below code is PL/SQL which can be executed in the database to store and compile the Java code.

    SET DEFINE OFF
    create or replace and compile
     java source named "SysLogger"
     as
    
    import java.io.*;
    import java.net.*;
    
    public class Syslog {
    
    	// Priorities.
    	public static final int LOG_EMERG = 0; // system is unusable
    	public static final int LOG_ALERT = 1; // action must be taken immediately
    	public static final int LOG_CRIT = 2; // critical conditions
    	public static final int LOG_ERR = 3; // error conditions
    	public static final int LOG_WARNING = 4; // warning conditions
    	public static final int LOG_NOTICE = 5; // normal but significant condition
    	public static final int LOG_INFO = 6; // informational
    	public static final int LOG_DEBUG = 7; // debug-level messages
    	public static final int LOG_PRIMASK = 0x0007; // mask to extract priority
    
    	// Facilities.
    	public static final int LOG_KERN = (0 << 3); // kernel messages
    	public static final int LOG_USER = (1 << 3); // random user-level messages
    	public static final int LOG_MAIL = (2 << 3); // mail system
    	public static final int LOG_DAEMON = (3 << 3); // system daemons
    	public static final int LOG_AUTH = (4 << 3); // security/authorization
    	public static final int LOG_SYSLOG = (5 << 3); // internal syslogd use
    	public static final int LOG_LPR = (6 << 3); // line printer subsystem
    	public static final int LOG_NEWS = (7 << 3); // network news subsystem
    	public static final int LOG_UUCP = (8 << 3); // UUCP subsystem
    	public static final int LOG_CRON = (15 << 3); // clock daemon
    	// Other codes through 15 reserved for system use.
    	public static final int LOG_LOCAL0 = (16 << 3); // reserved for local use
    	public static final int LOG_LOCAL1 = (17 << 3); // reserved for local use
    	public static final int LOG_LOCAL2 = (18 << 3); // reserved for local use
    	public static final int LOG_LOCAL3 = (19 << 3); // reserved for local use
    	public static final int LOG_LOCAL4 = (20 << 3); // reserved for local use
    	public static final int LOG_LOCAL5 = (21 << 3); // reserved for local use
    	public static final int LOG_LOCAL6 = (22 << 3); // reserved for local use
    	public static final int LOG_LOCAL7 = (23 << 3); // reserved for local use
    
    	public static final int LOG_FACMASK = 0x03F8; // mask to extract facility
    
    	// Option flags.
    	public static final int LOG_PID = 0x01; // log the pid with each message
    	public static final int LOG_CONS = 0x02; // log on the console if errors
    	public static final int LOG_NDELAY = 0x08; // don't delay open
    	public static final int LOG_NOWAIT = 0x10; // don't wait for console forks
    
    	private static final int DEFAULT_PORT = 514;
    
    	/// Use this method to log your syslog messages. The facility and
    	// level are the same as their Unix counterparts, and the Syslog
    	// class provides constants for these fields. The msg is what is
    	// actually logged.
    	// @exception SyslogException if there was a problem
    	@SuppressWarnings("deprecation")
    	public static String syslog(String hostname, Integer port, String ident, Integer facility, Integer priority, String msg) {
    		try {
    			InetAddress address;
    			if (hostname == null) {
    				address = InetAddress.getLocalHost();
    			} else {
    				address = InetAddress.getByName(hostname);
    			}
    
    			if (port == null) {
    				port = new Integer(DEFAULT_PORT);
    			}
    			if (facility == null) {
    				facility = 1; // means user-level messages
    			}
    			if (ident == null)
    				ident = new String(Thread.currentThread().getName());
    
    			int pricode;
    			int length;
    			int idx;
    			byte[] data;
    			String strObj;
    
    			pricode = MakePriorityCode(facility, priority);
    			Integer priObj = new Integer(pricode);
    
    			length = 4 + ident.length() + msg.length() + 1;
    			length += (pricode > 99) ? 3 : ((pricode > 9) ? 2 : 1);
    
    			data = new byte[length];
    
    			idx = 0;
    			data[idx++] = '<';
    
    			strObj = Integer.toString(priObj.intValue());
    			strObj.getBytes(0, strObj.length(), data, idx);
    			idx += strObj.length();
    
    			data[idx++] = '>';
    
    			ident.getBytes(0, ident.length(), data, idx);
    			idx += ident.length();
    
    			data[idx++] = ':';
    			data[idx++] = ' ';
    
    			msg.getBytes(0, msg.length(), data, idx);
    			idx += msg.length();
    
    			data[idx] = 0;
    
    			DatagramPacket packet = new DatagramPacket(data, length, address, port);
    			DatagramSocket socket = new DatagramSocket();
    			socket.send(packet);
    			socket.close();
    		} catch (IOException e) {
    			return "error sending message: '" + e.getMessage() + "'";
    		}
    		return "";
    	}
    
    	private static int MakePriorityCode(int facility, int priority) {
    		return ((facility & LOG_FACMASK) | priority);
    	}
    }
    /
    

    Make the Java code available from PL/SQL

    create or replace
    procedure SYSLOGGER(p_hostname in varchar2, p_port in number, p_ident in varchar2, p_facility in number, p_priority in number, p_msg in varchar2)
    as
    language java
    name 'Syslog.syslog(java.lang.String,java.lang.Integer,java.lang.String,java.lang.Integer,java.lang.Integer,java.lang.String)';
    

    Test the Java code

    DECLARE
      P_HOSTNAME VARCHAR2(200);
      P_PORT NUMBER;
      P_IDENT VARCHAR2(200);
      P_FACILITY NUMBER;
      P_PRIORITY NUMBER;
      P_MSG VARCHAR2(200);
    BEGIN
      P_HOSTNAME := NULL;
      P_PORT := NULL;
      P_IDENT := 'Syslogtest';
      P_FACILITY := NULL;
      P_PRIORITY := 1;
      P_MSG := 'Hi there';
    
      SYSLOGGER(
        P_HOSTNAME => P_HOSTNAME,
        P_PORT => P_PORT,
        P_IDENT => P_IDENT,
        P_FACILITY => P_FACILITY,
        P_PRIORITY => P_PRIORITY,
        P_MSG => P_MSG
      );
    END;
    

    Now check your local syslog (often /var/log/messages) for entries like

    Oct 26 14:31:22 oracle-19c-vagrant Syslogtest: Hi there
    

    Considerations

    TCP instead of UDP

    This example uses UDP. UDP does not have guaranteed delivery. You can just as well implement this with TCP. Using TCP you do not require custom Java code in the database but you do require Access Control List (ACL) configuration and have to write PL/SQL (using UTL_TCP) to do the calls to rsyslog. An example on how this can be implemented, can be found here.

    Custom audit logging to syslog

    Using the Oracle feature Fine Grained Auditing (FGA), you can configure a handler procedure which is called when a policy is triggered. Within this procedure you can call the PL/SQL which does syslog logging. The PL/SQL procedure has a SYS_CONTEXT available which contains information like the user, proxy user and even the SQL query and bind variables which triggered the policy (when using DB+EXTENDED logging).

    If you want to store what a certain user has seen, you can use Flashback Data Archive (FDA) in addition to FGA. This feature is available for free in Oracle DB 12c and higher. In older versions this depends on the Advanced Compression option. If you combine the FDA and the FGA, you can execute the original query on the data at a certain point in time (on historic data). You can even store the SYS_CONTEXT in the FDA which allows for a more accurate reproduction of what happened in the past. When using these options, mind the performance impact and create specific tablespaces for the FDA and FGA data.

    The post Oracle Database: Write arbitrary log messages to the syslog from PL/SQL appeared first on AMIS Oracle and Java Blog.

    Viewing all 1414 articles
    Browse latest View live


    Latest Images